Precision
Indicators
A complete analytical toolkit for futures traders — 31 professional indicators across trend, momentum, price structure, volume, ICT concepts, and market internals. Built on 20+ years of market research.
One Indicator or
The Entire Suite
Start with a single indicator, get the full suite, or skip the indicator subscription entirely — every EdgeMax engine subscription includes all indicators at no extra cost.
Our flagship indicator — the daily roadmap that started it all.
- BWT Core Levels™ indicator
- Daily range projection with probabilities
- London session overlay
- Dynamic recalibration
All 31 indicators — trend, momentum, structure, ICT, and more.
- All 31 BWT Precision Indicators
- 8 complete indicator suites
- Monthly or yearly subscription
- NinjaTrader 8 required
All indicators included free — plus the full execution engine.
- All 31 indicators included free
- Algo Mode™ + Discretionary Mode™
- 5 signal modules + bracket management
- Only $50 more than indicators alone
Trend & Moving
Average Suite
Volatility-adaptive trend following using ATR-based trailing stops. Plots colored buy/sell trail lines, reversal arrows, and optional bar painting. The engine behind the Volatility Stop signal module.
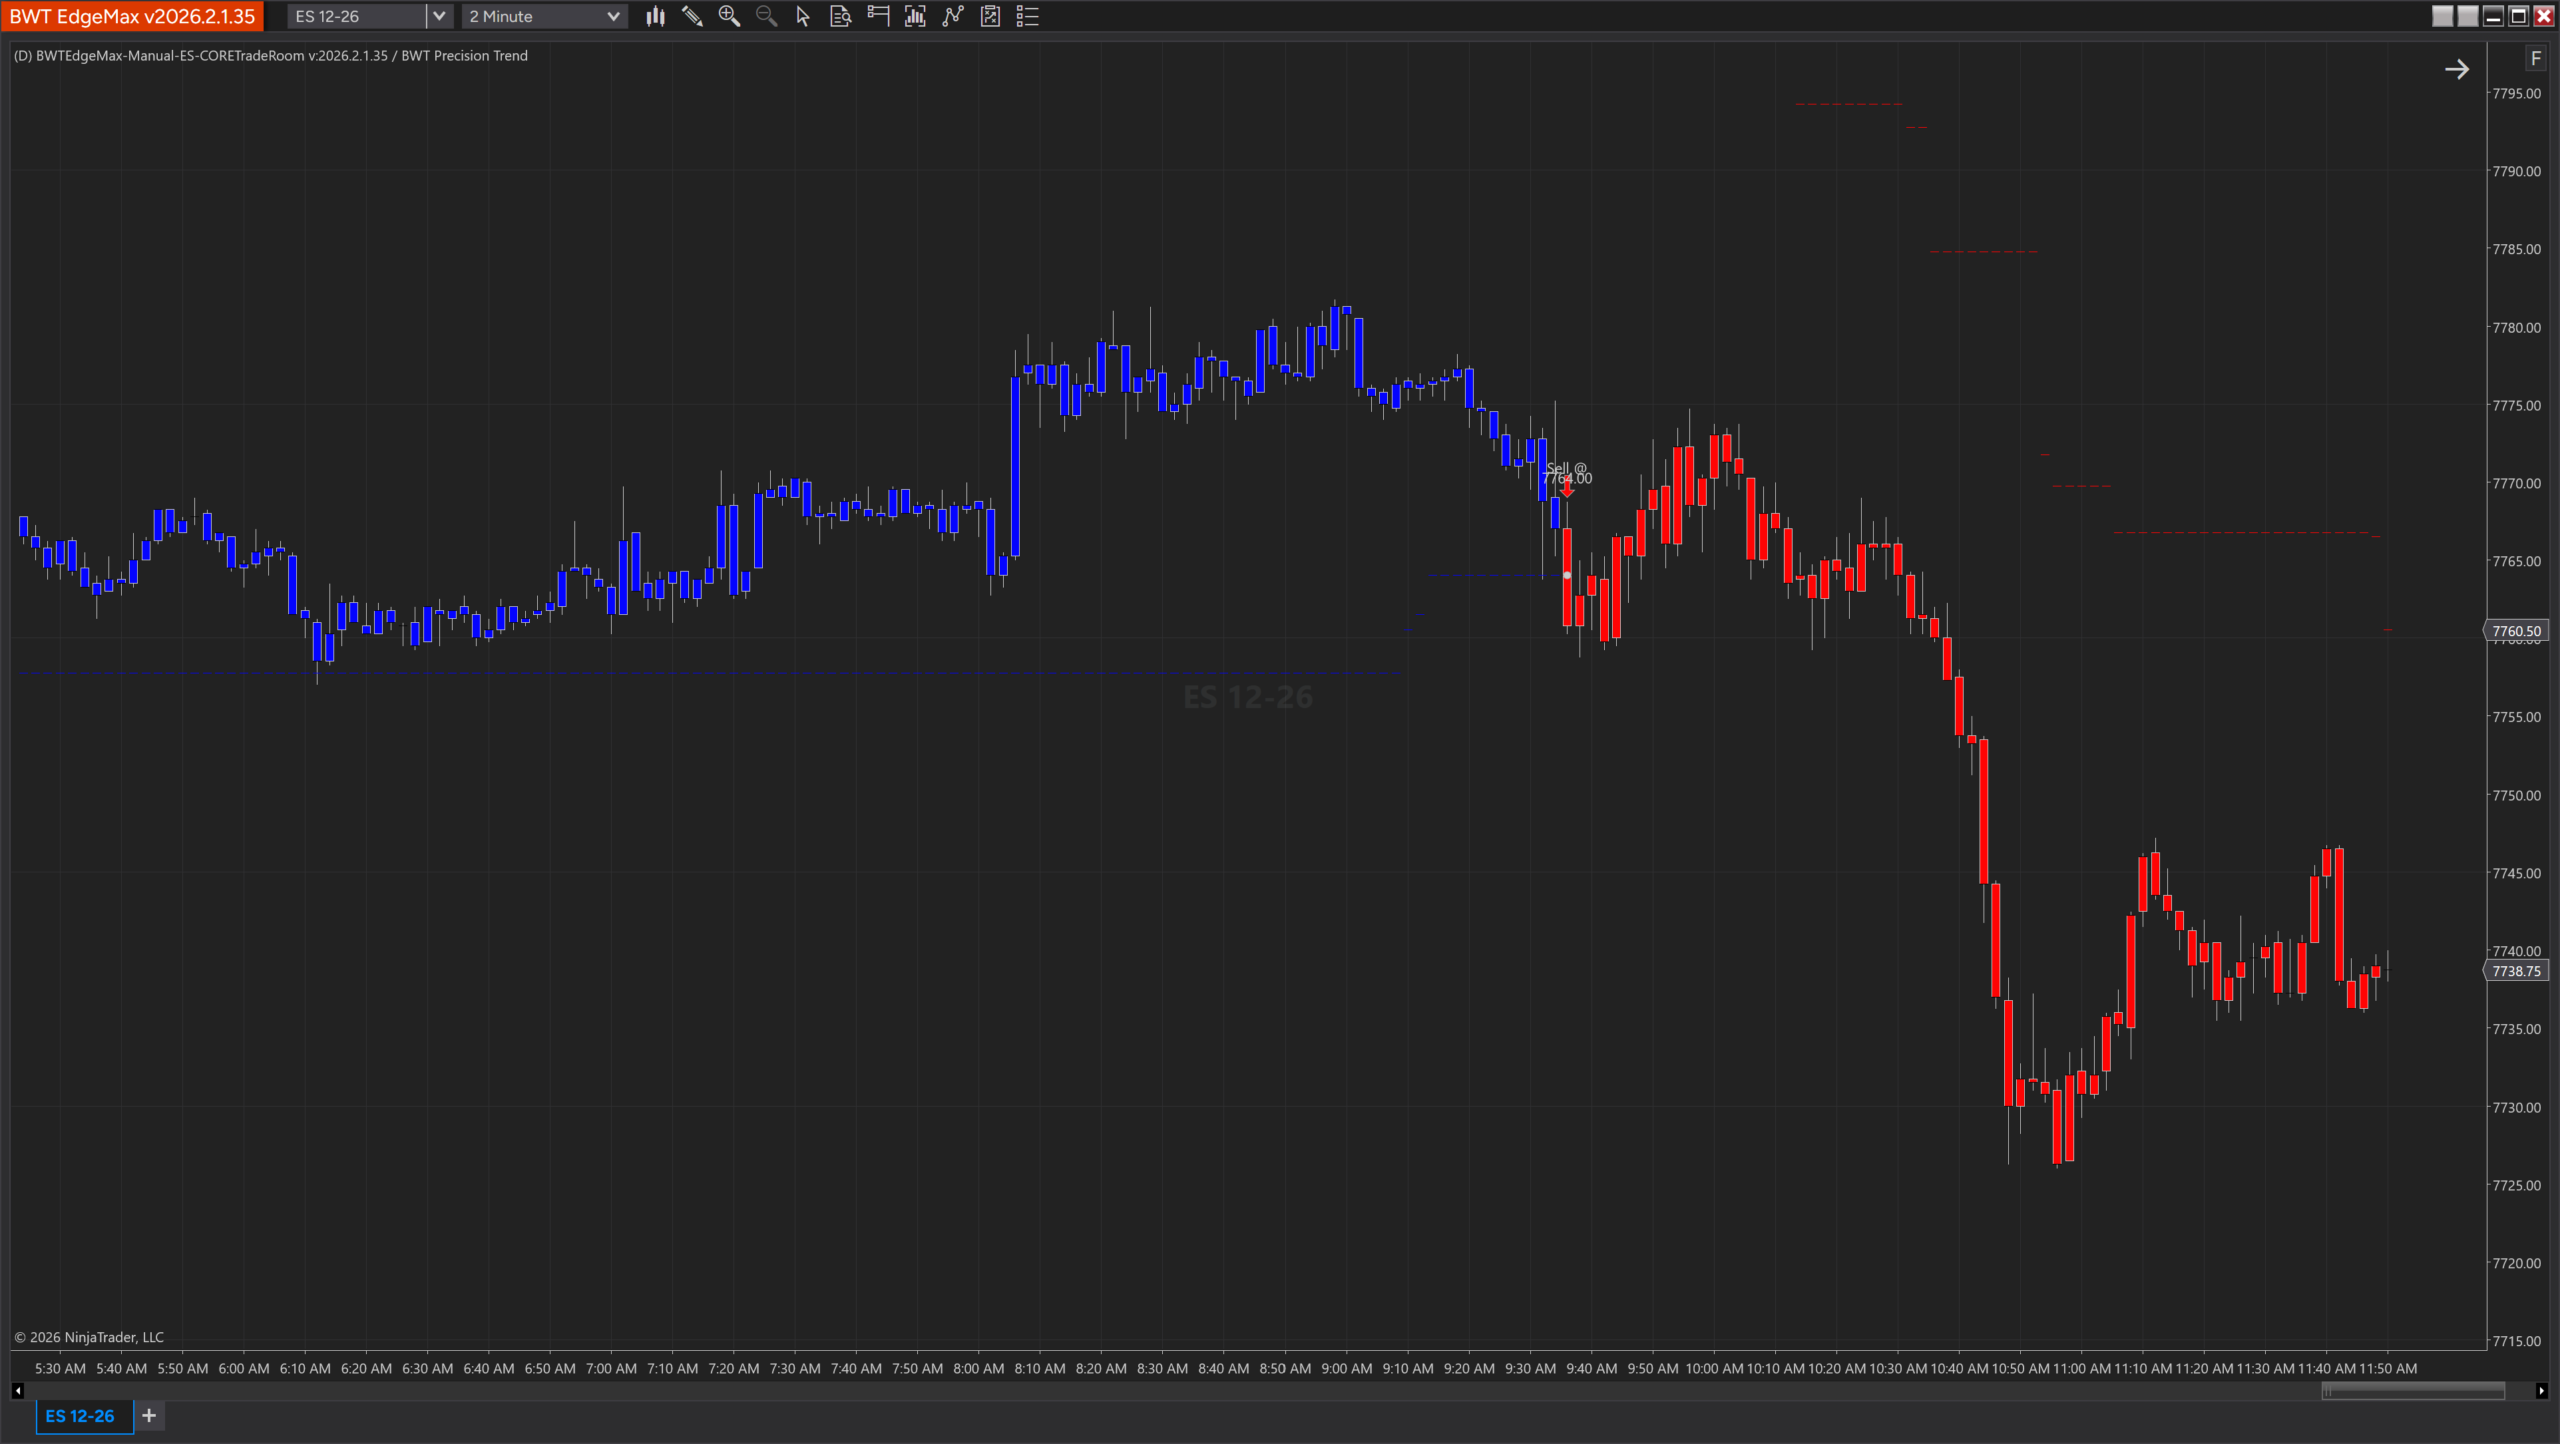
Multi-timeframe extension. Paints chart background to show macro trend context from a higher timeframe — blue for long, red for short. Supports minute, hour, day, Renko, and Kagi.
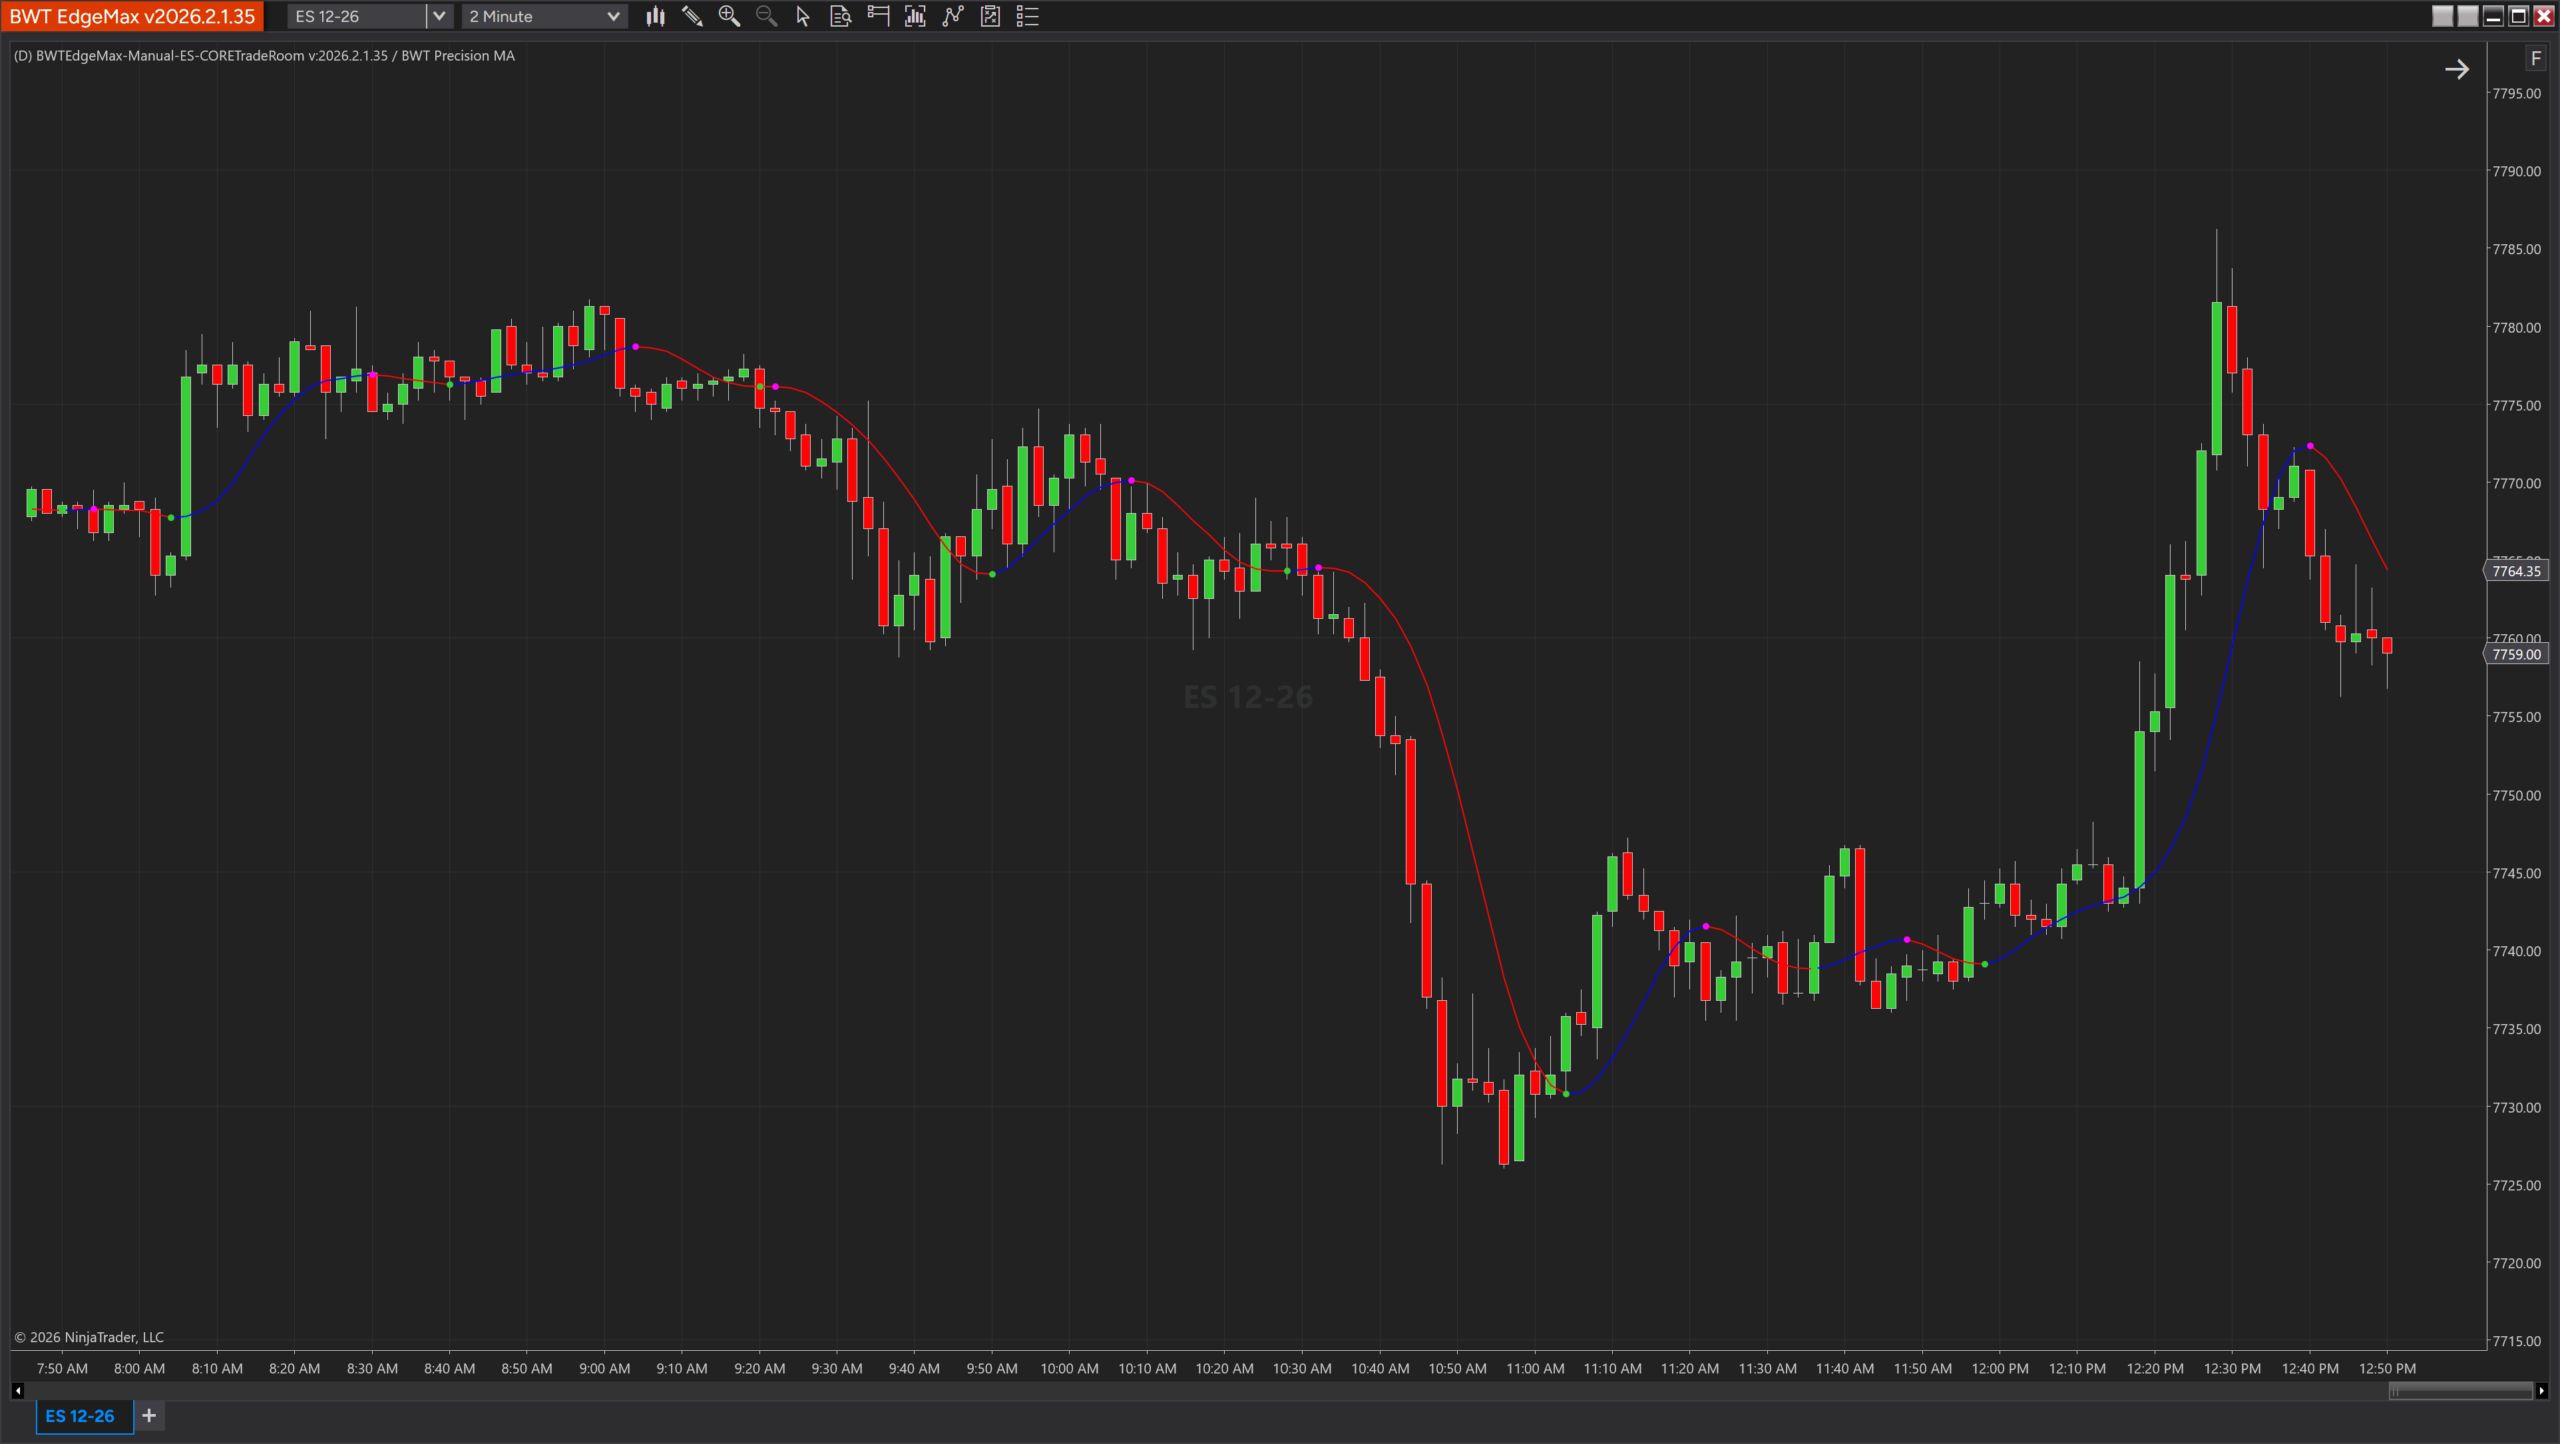
Multi-timeframeMulti-mode moving average with turning-point detection. Supports TMA, Adaptive, EMA, SMA, and VWMA. Color-coded direction with marked turning points for early trend change identification.
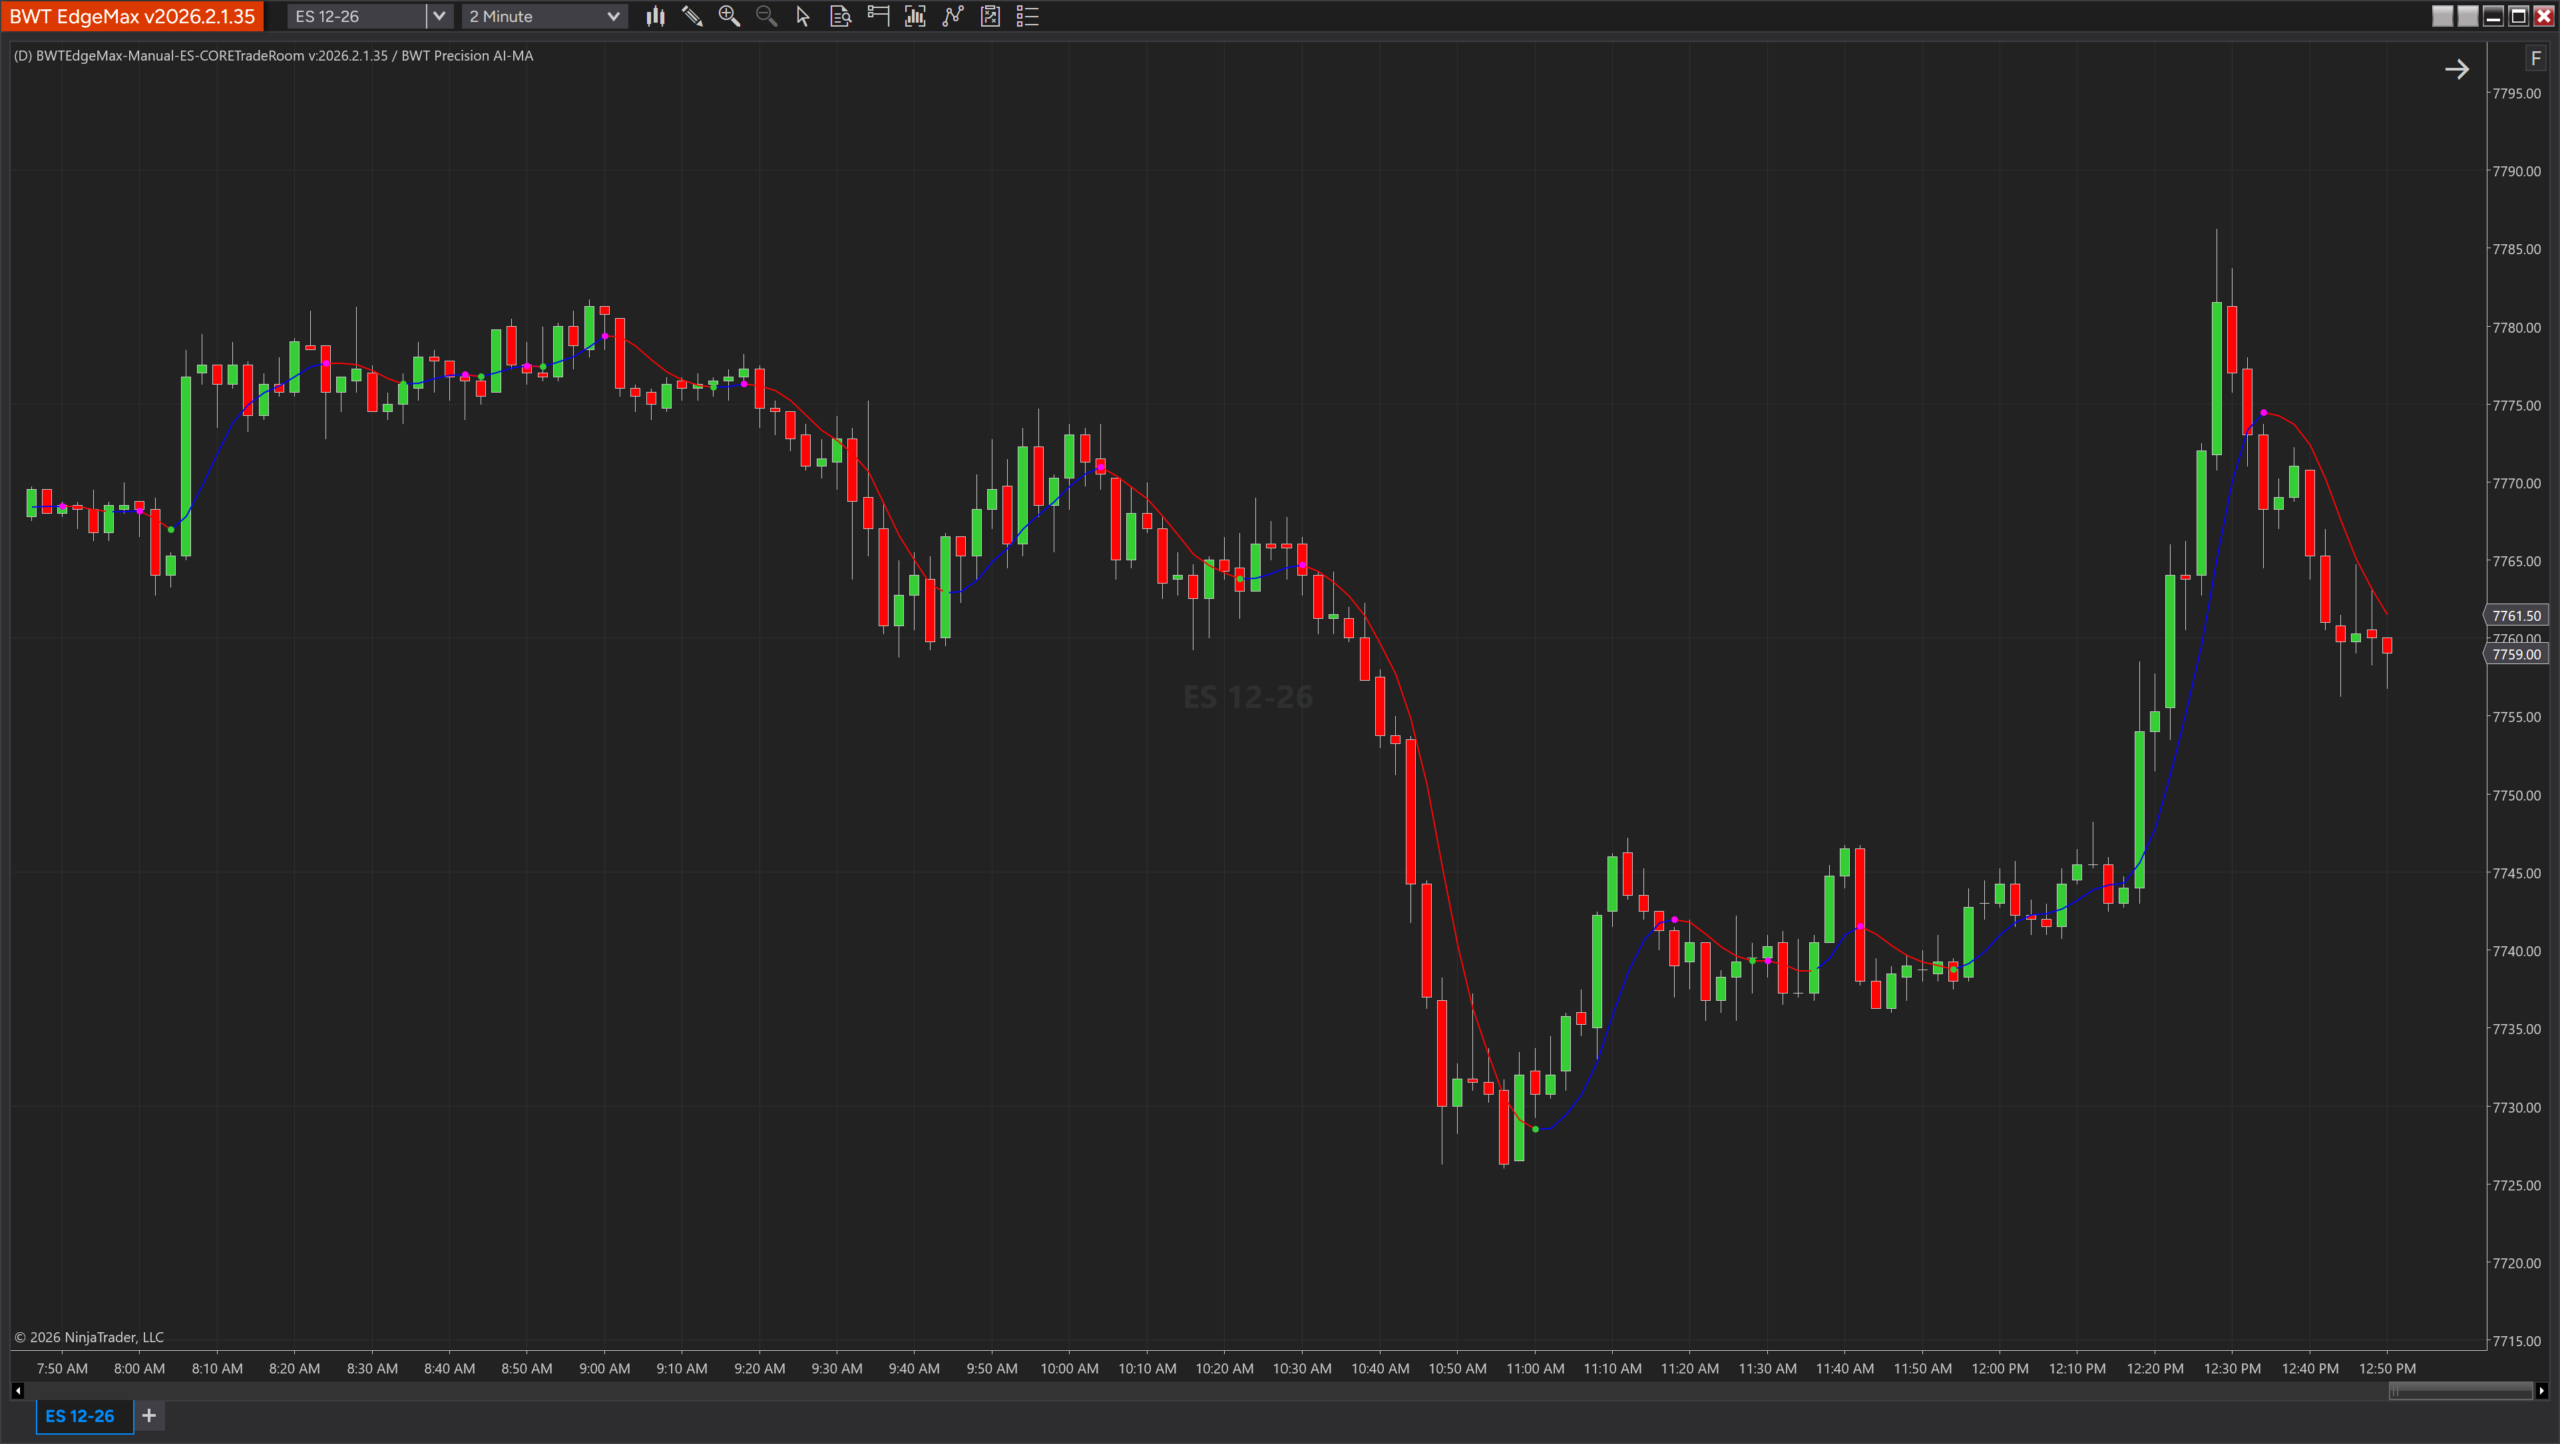
Phase-adjusted adaptive MA using 3-pole EMA filtering. Control lead/lag behavior directly — dial in responsiveness without sacrificing smoothness. Color-coded rising and falling output.
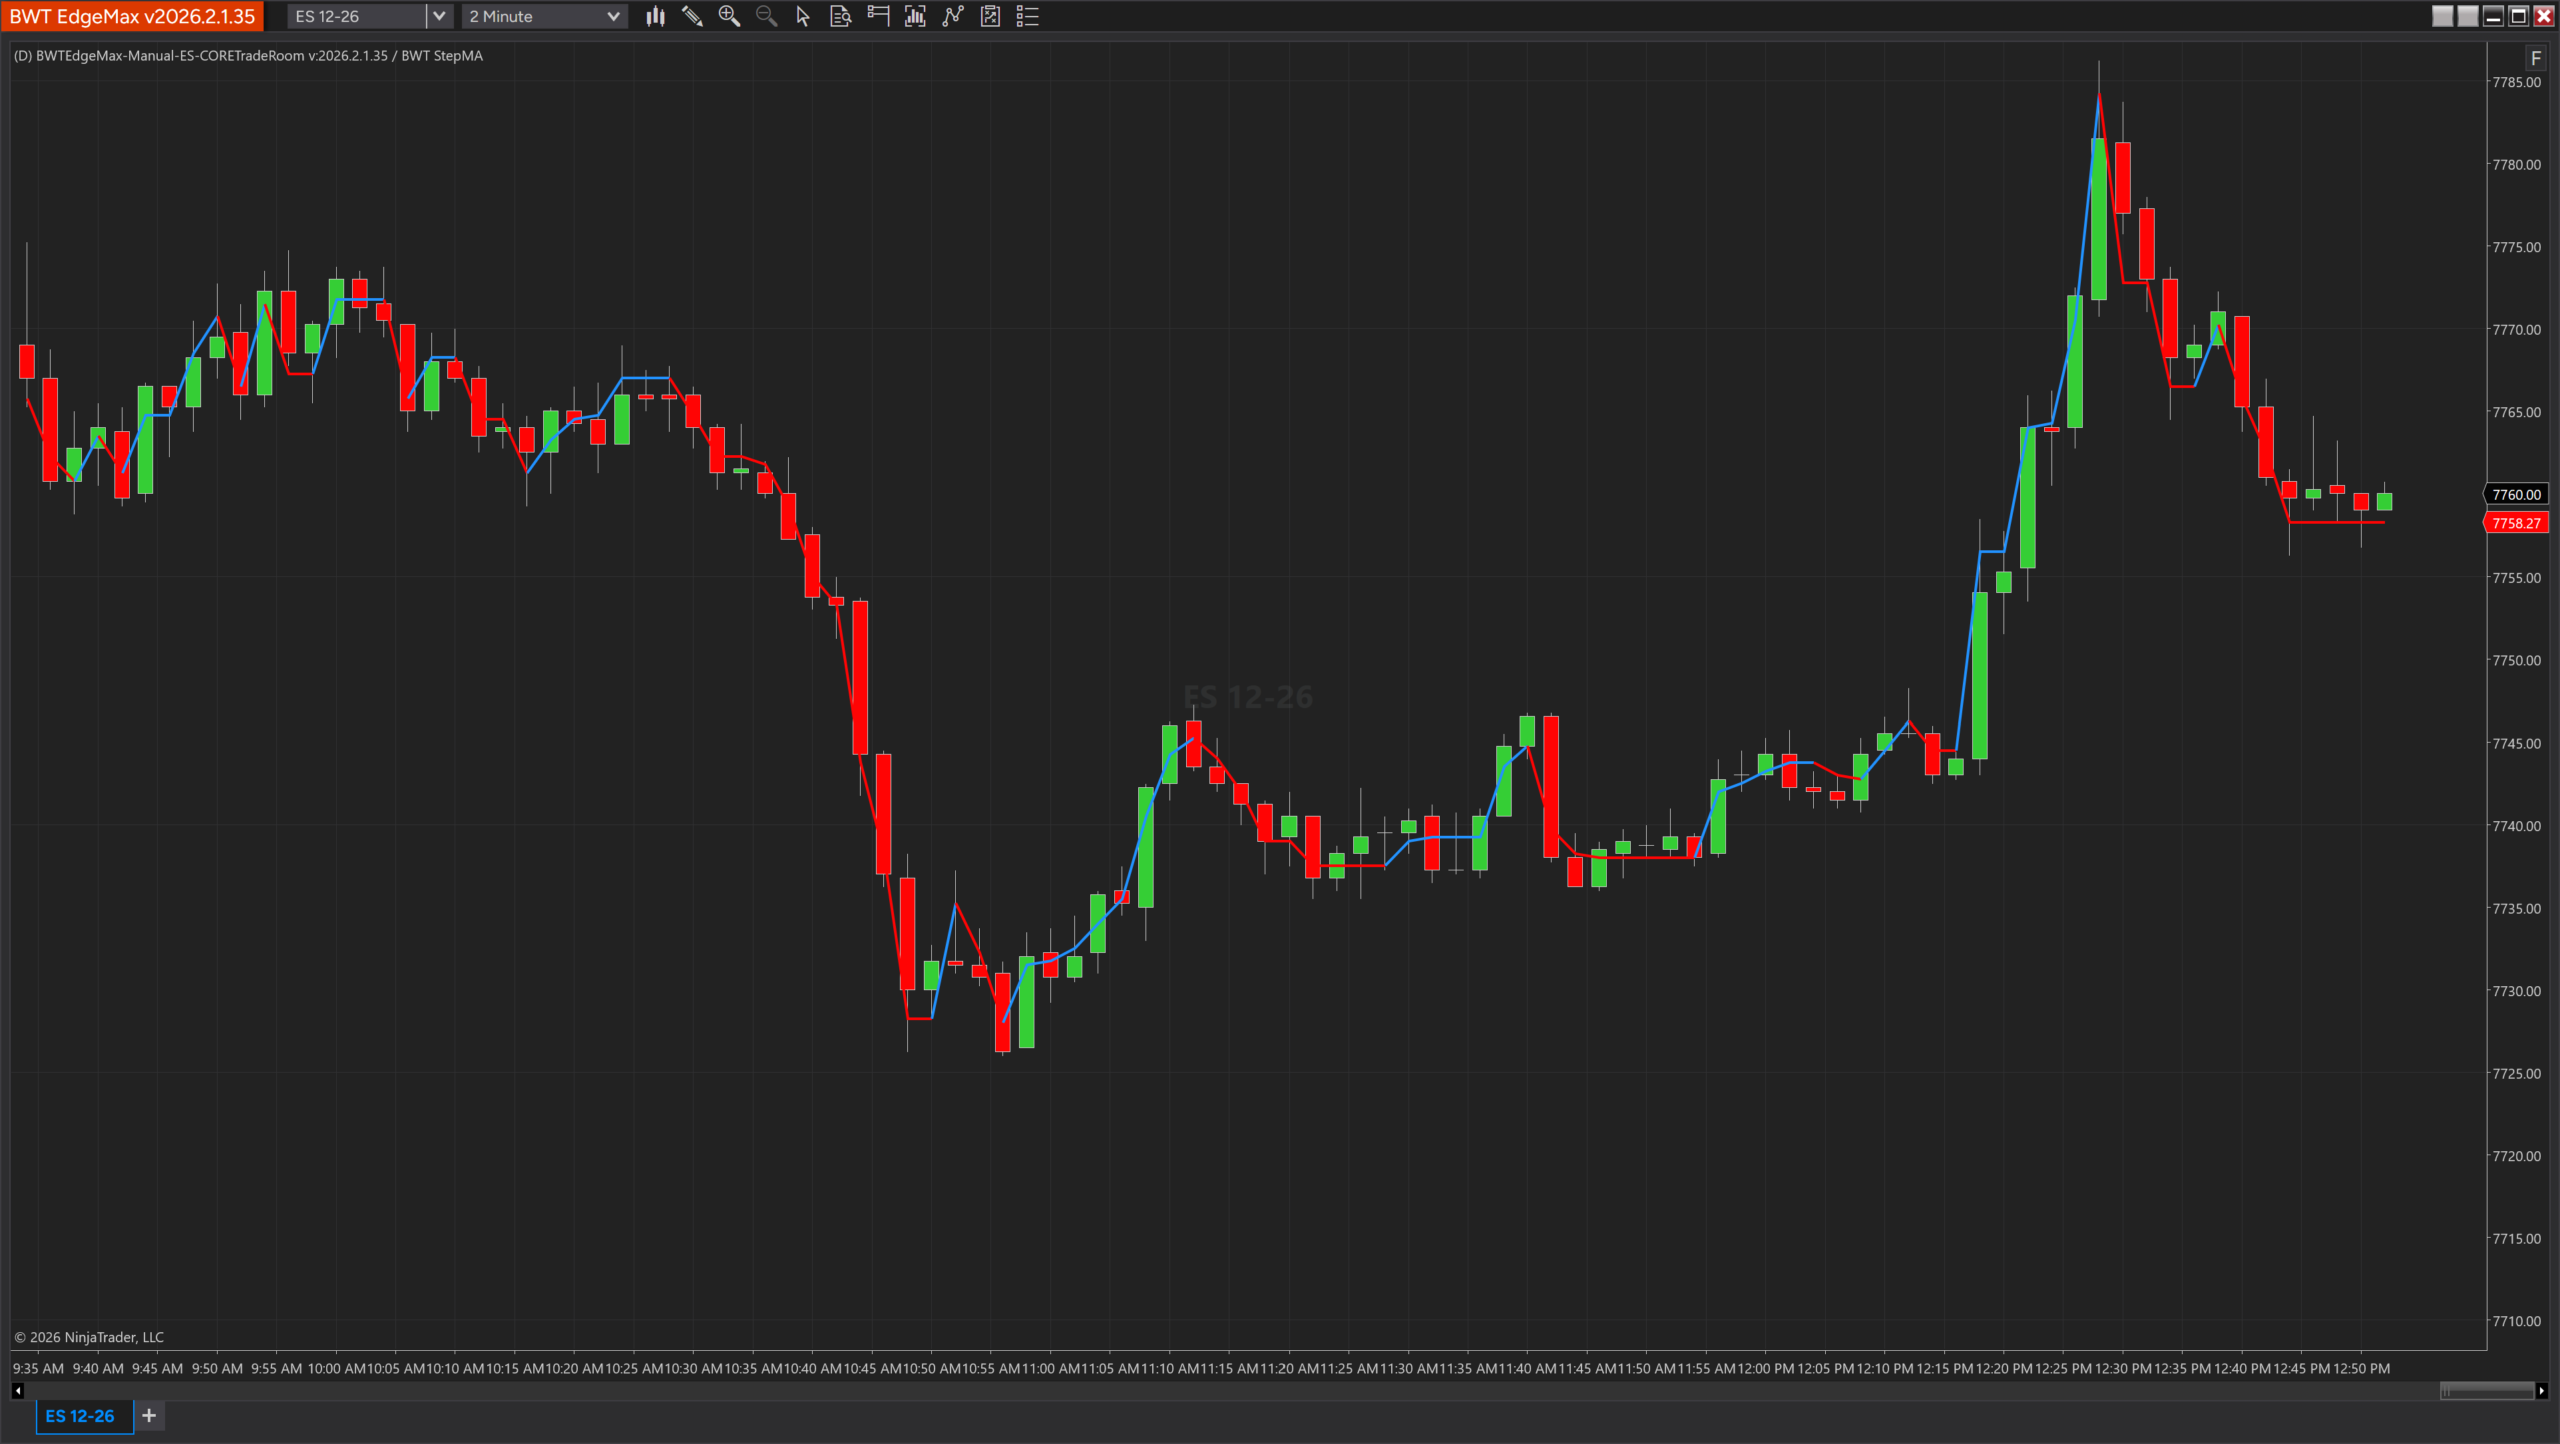
Staircase-style adaptive MA that steps at defined tick intervals. Eliminates noise between steps for clean trend visualization. Optional directional arrows and bar coloring.
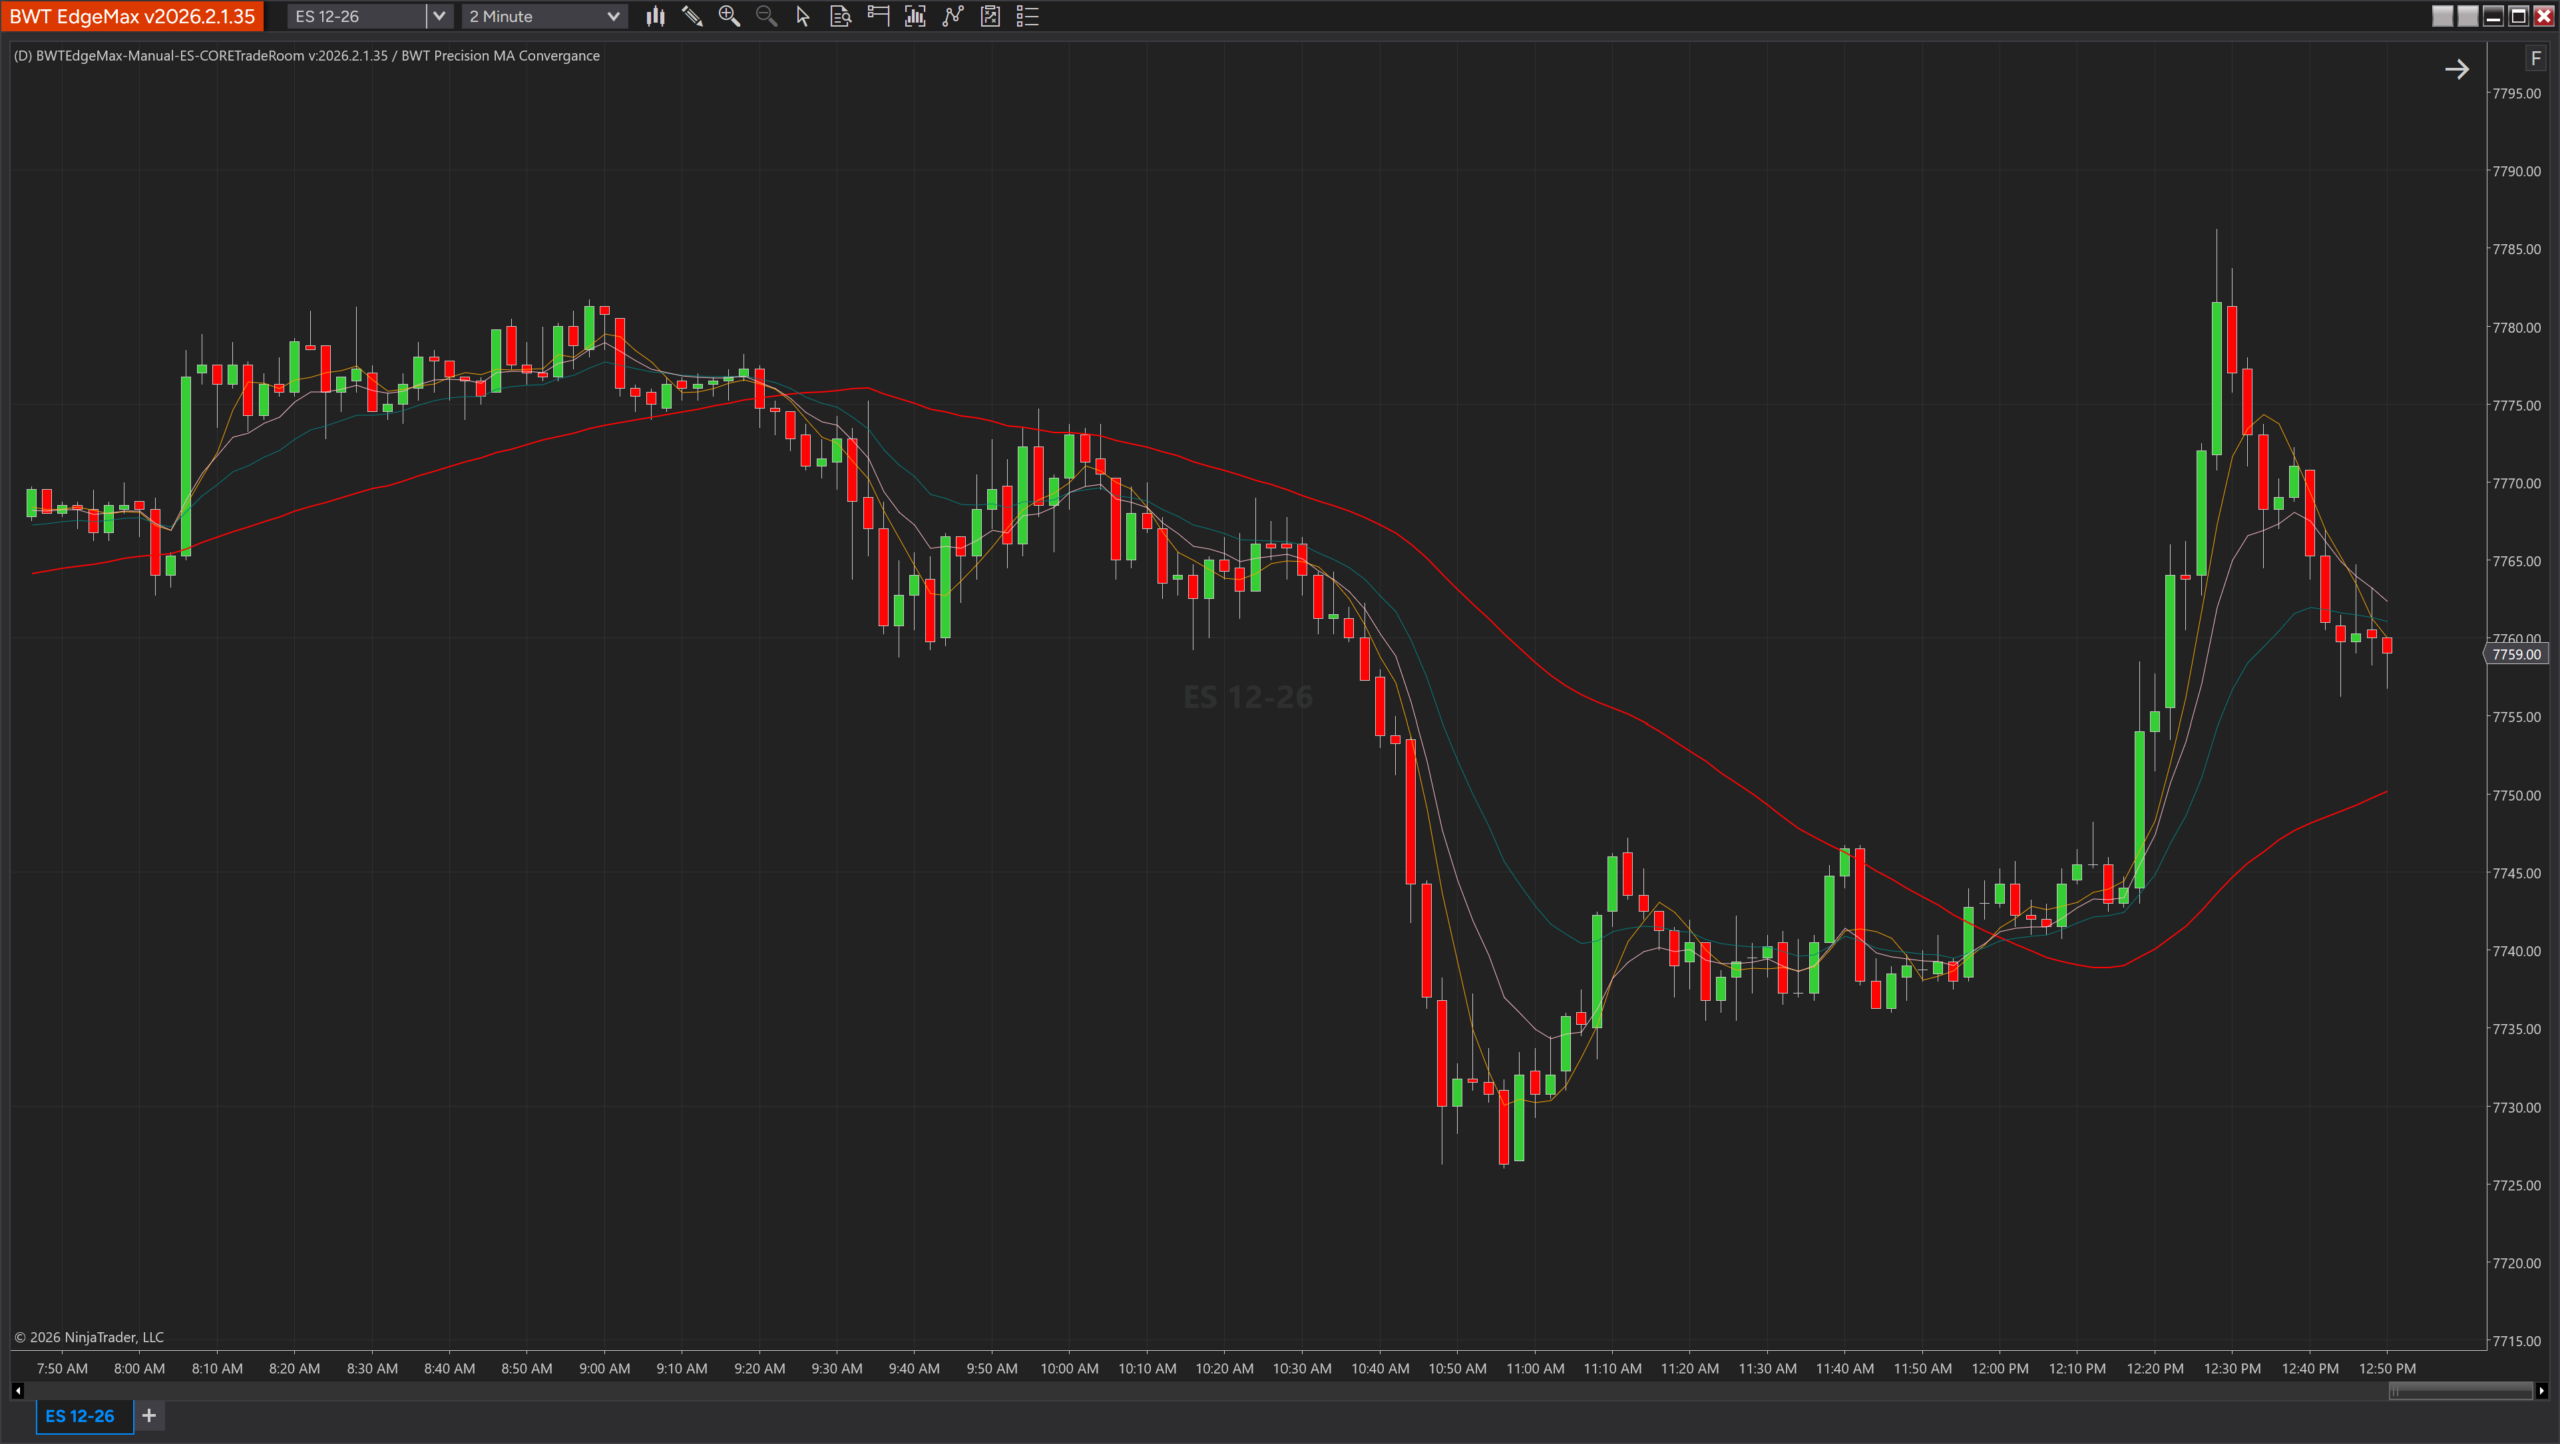
Plots four moving averages simultaneously for crossover and confluence identification. See alignment and divergence at a glance across multiple timeframes.
Oscillator &
Momentum Suite
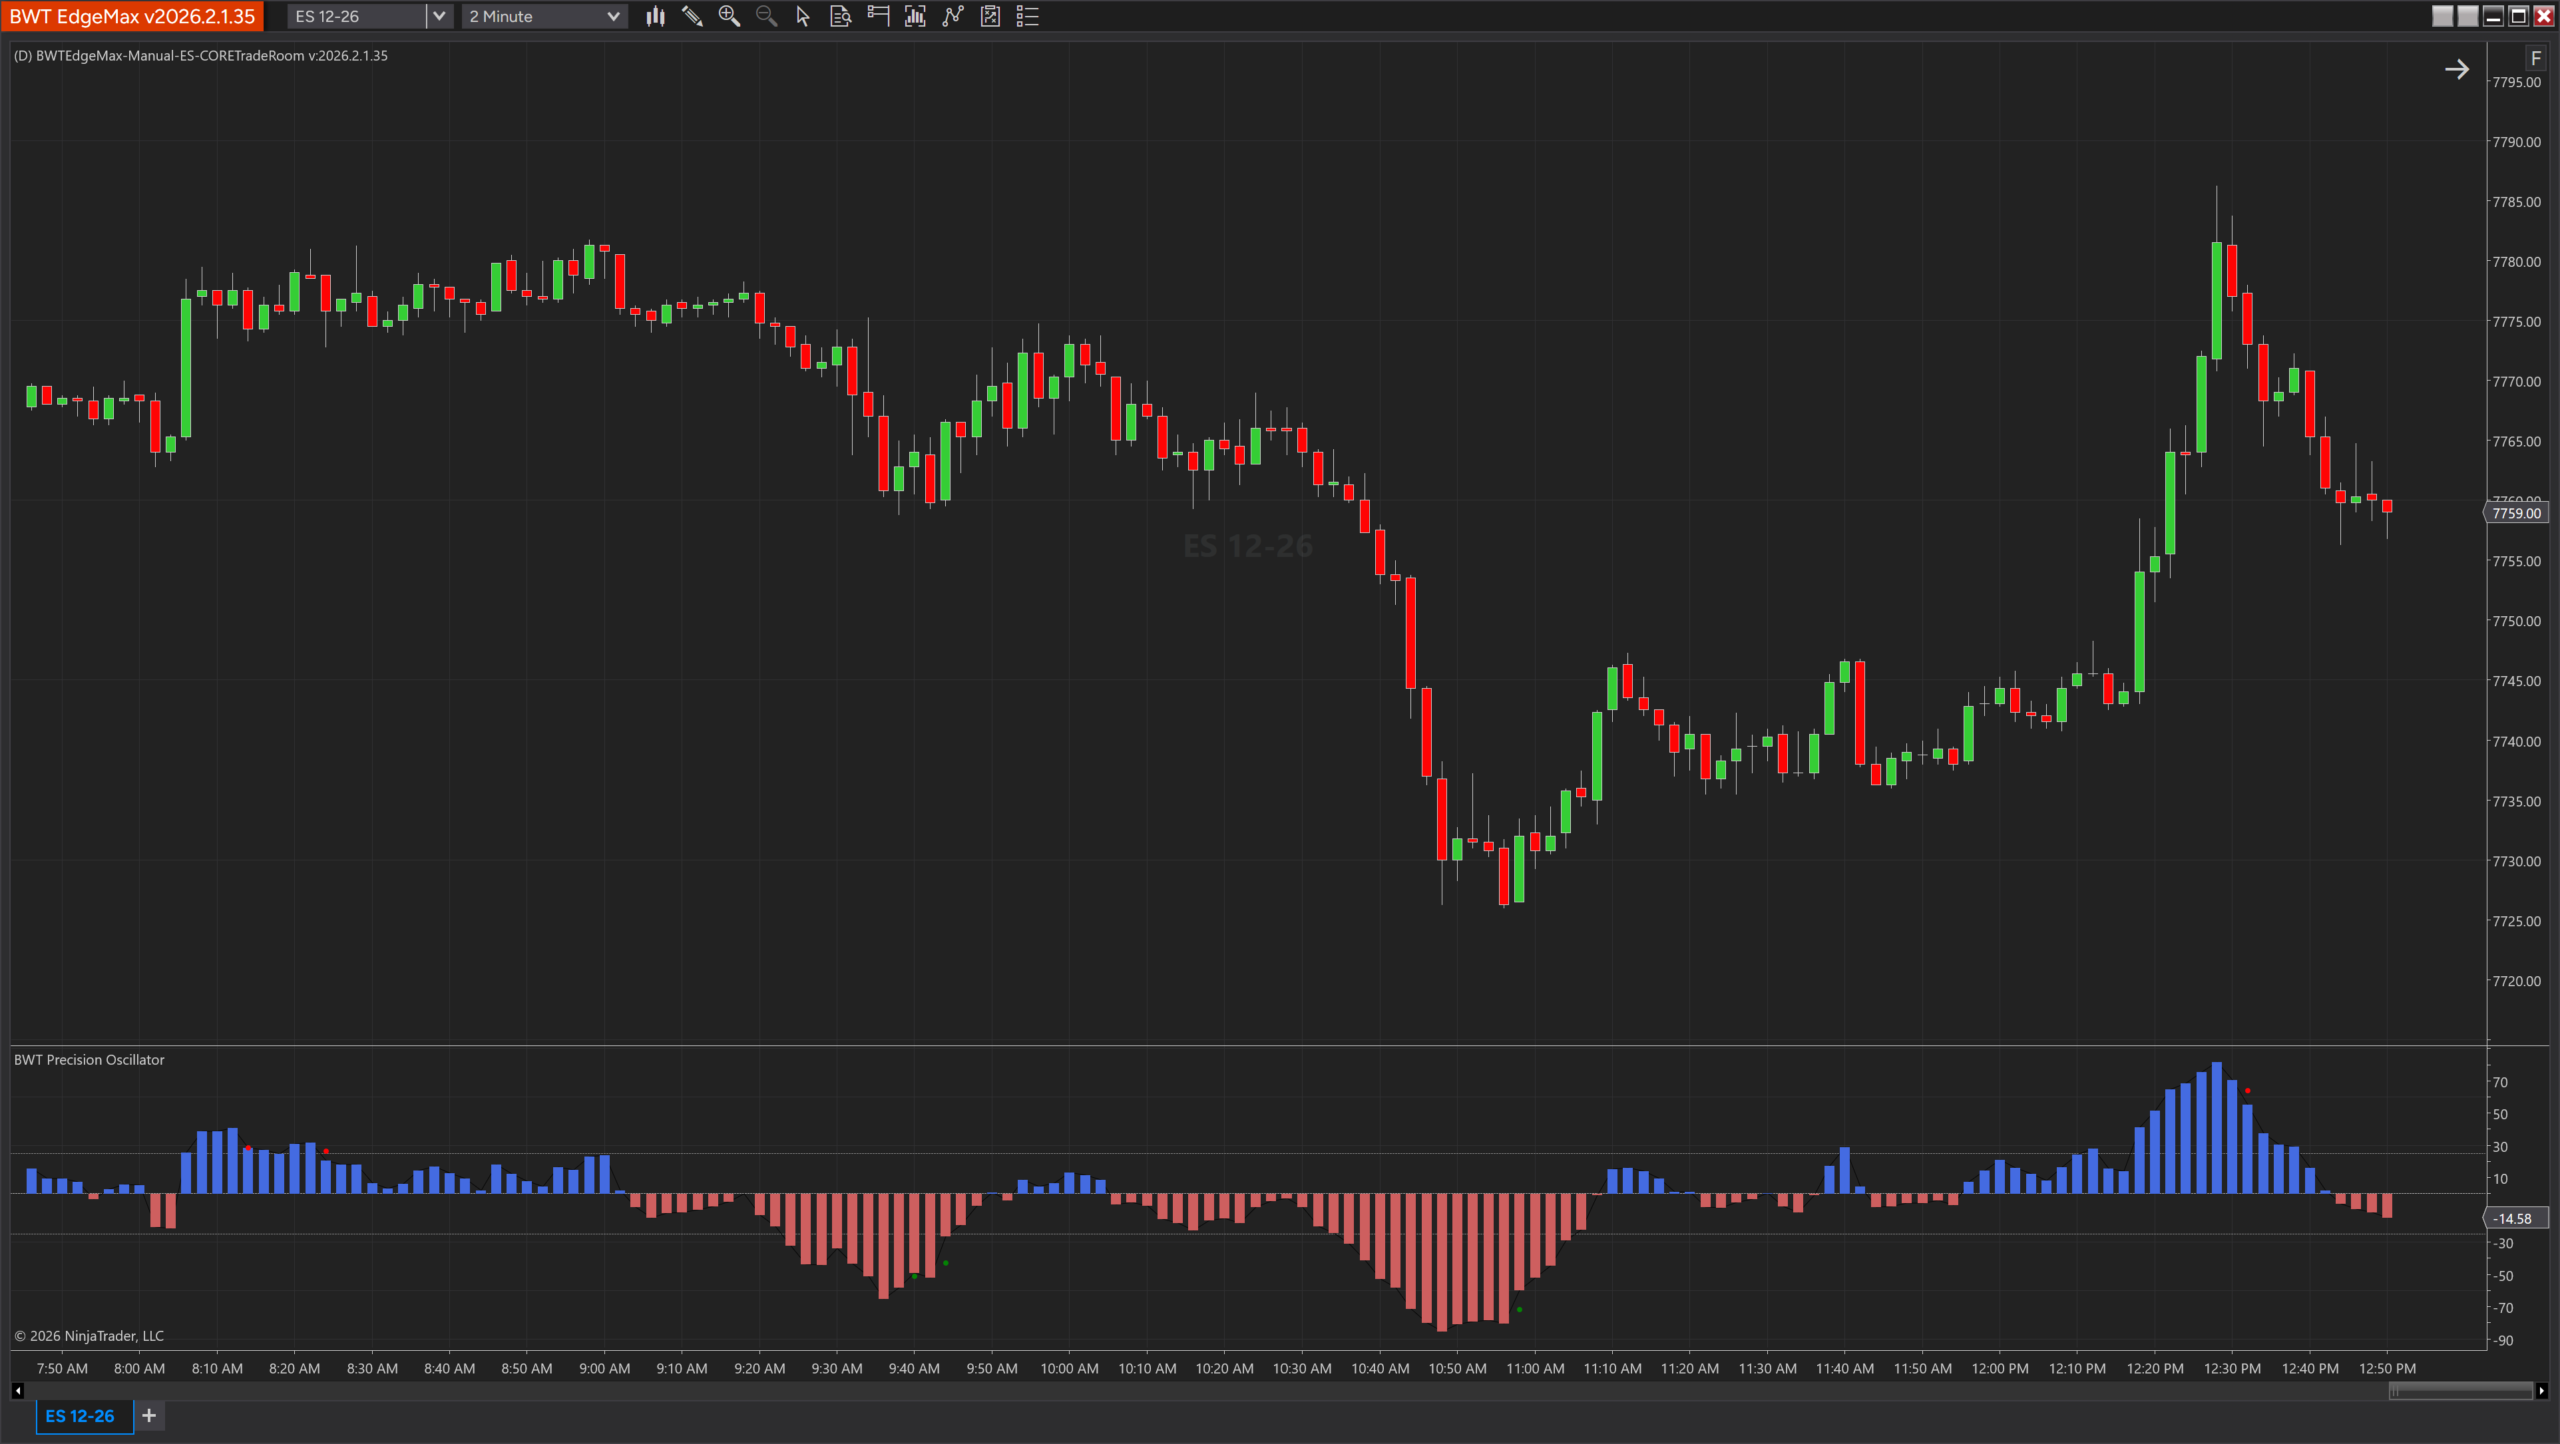
TSI-based momentum oscillator with signal line crossovers. Plots TSI line, EMA signal, colored histogram, and crossover dots — green for bullish, red for bearish momentum shifts.
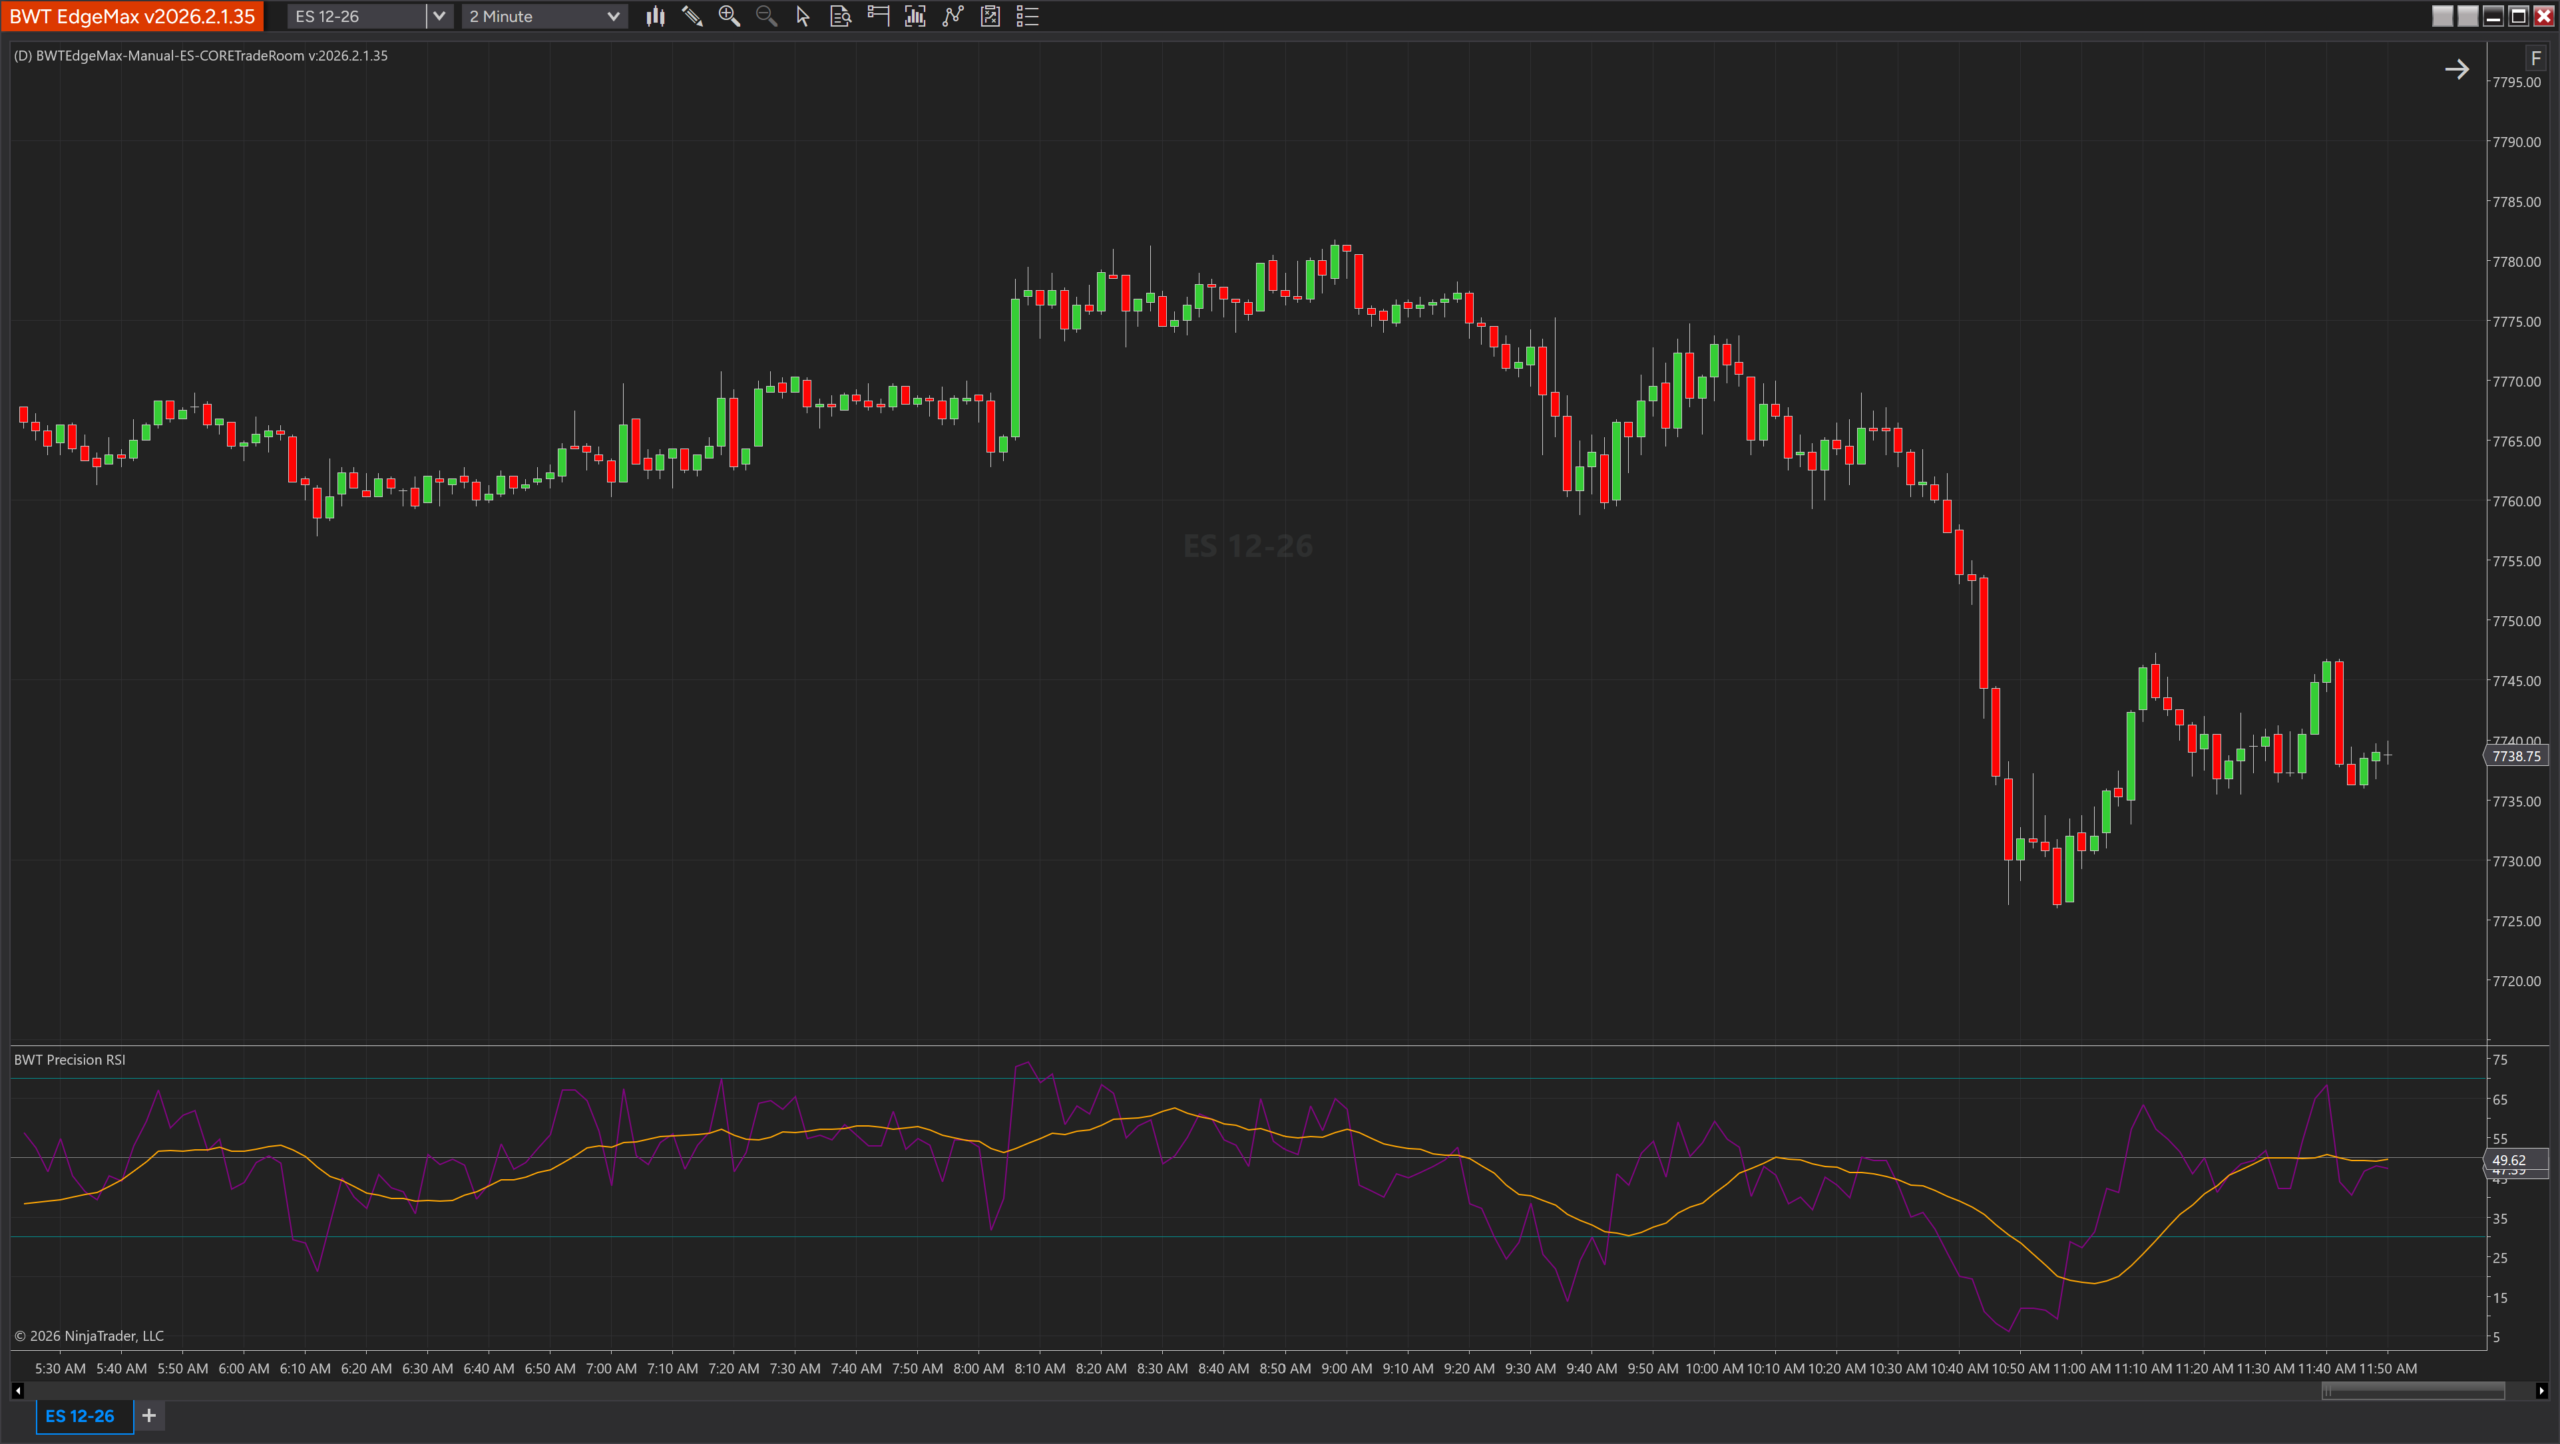
Classic RSI with optional MA smoothing (SMA, EMA, WMA, VWMA). Plots RSI plus smoothed average with standard overbought/oversold reference levels. Clean and configurable.
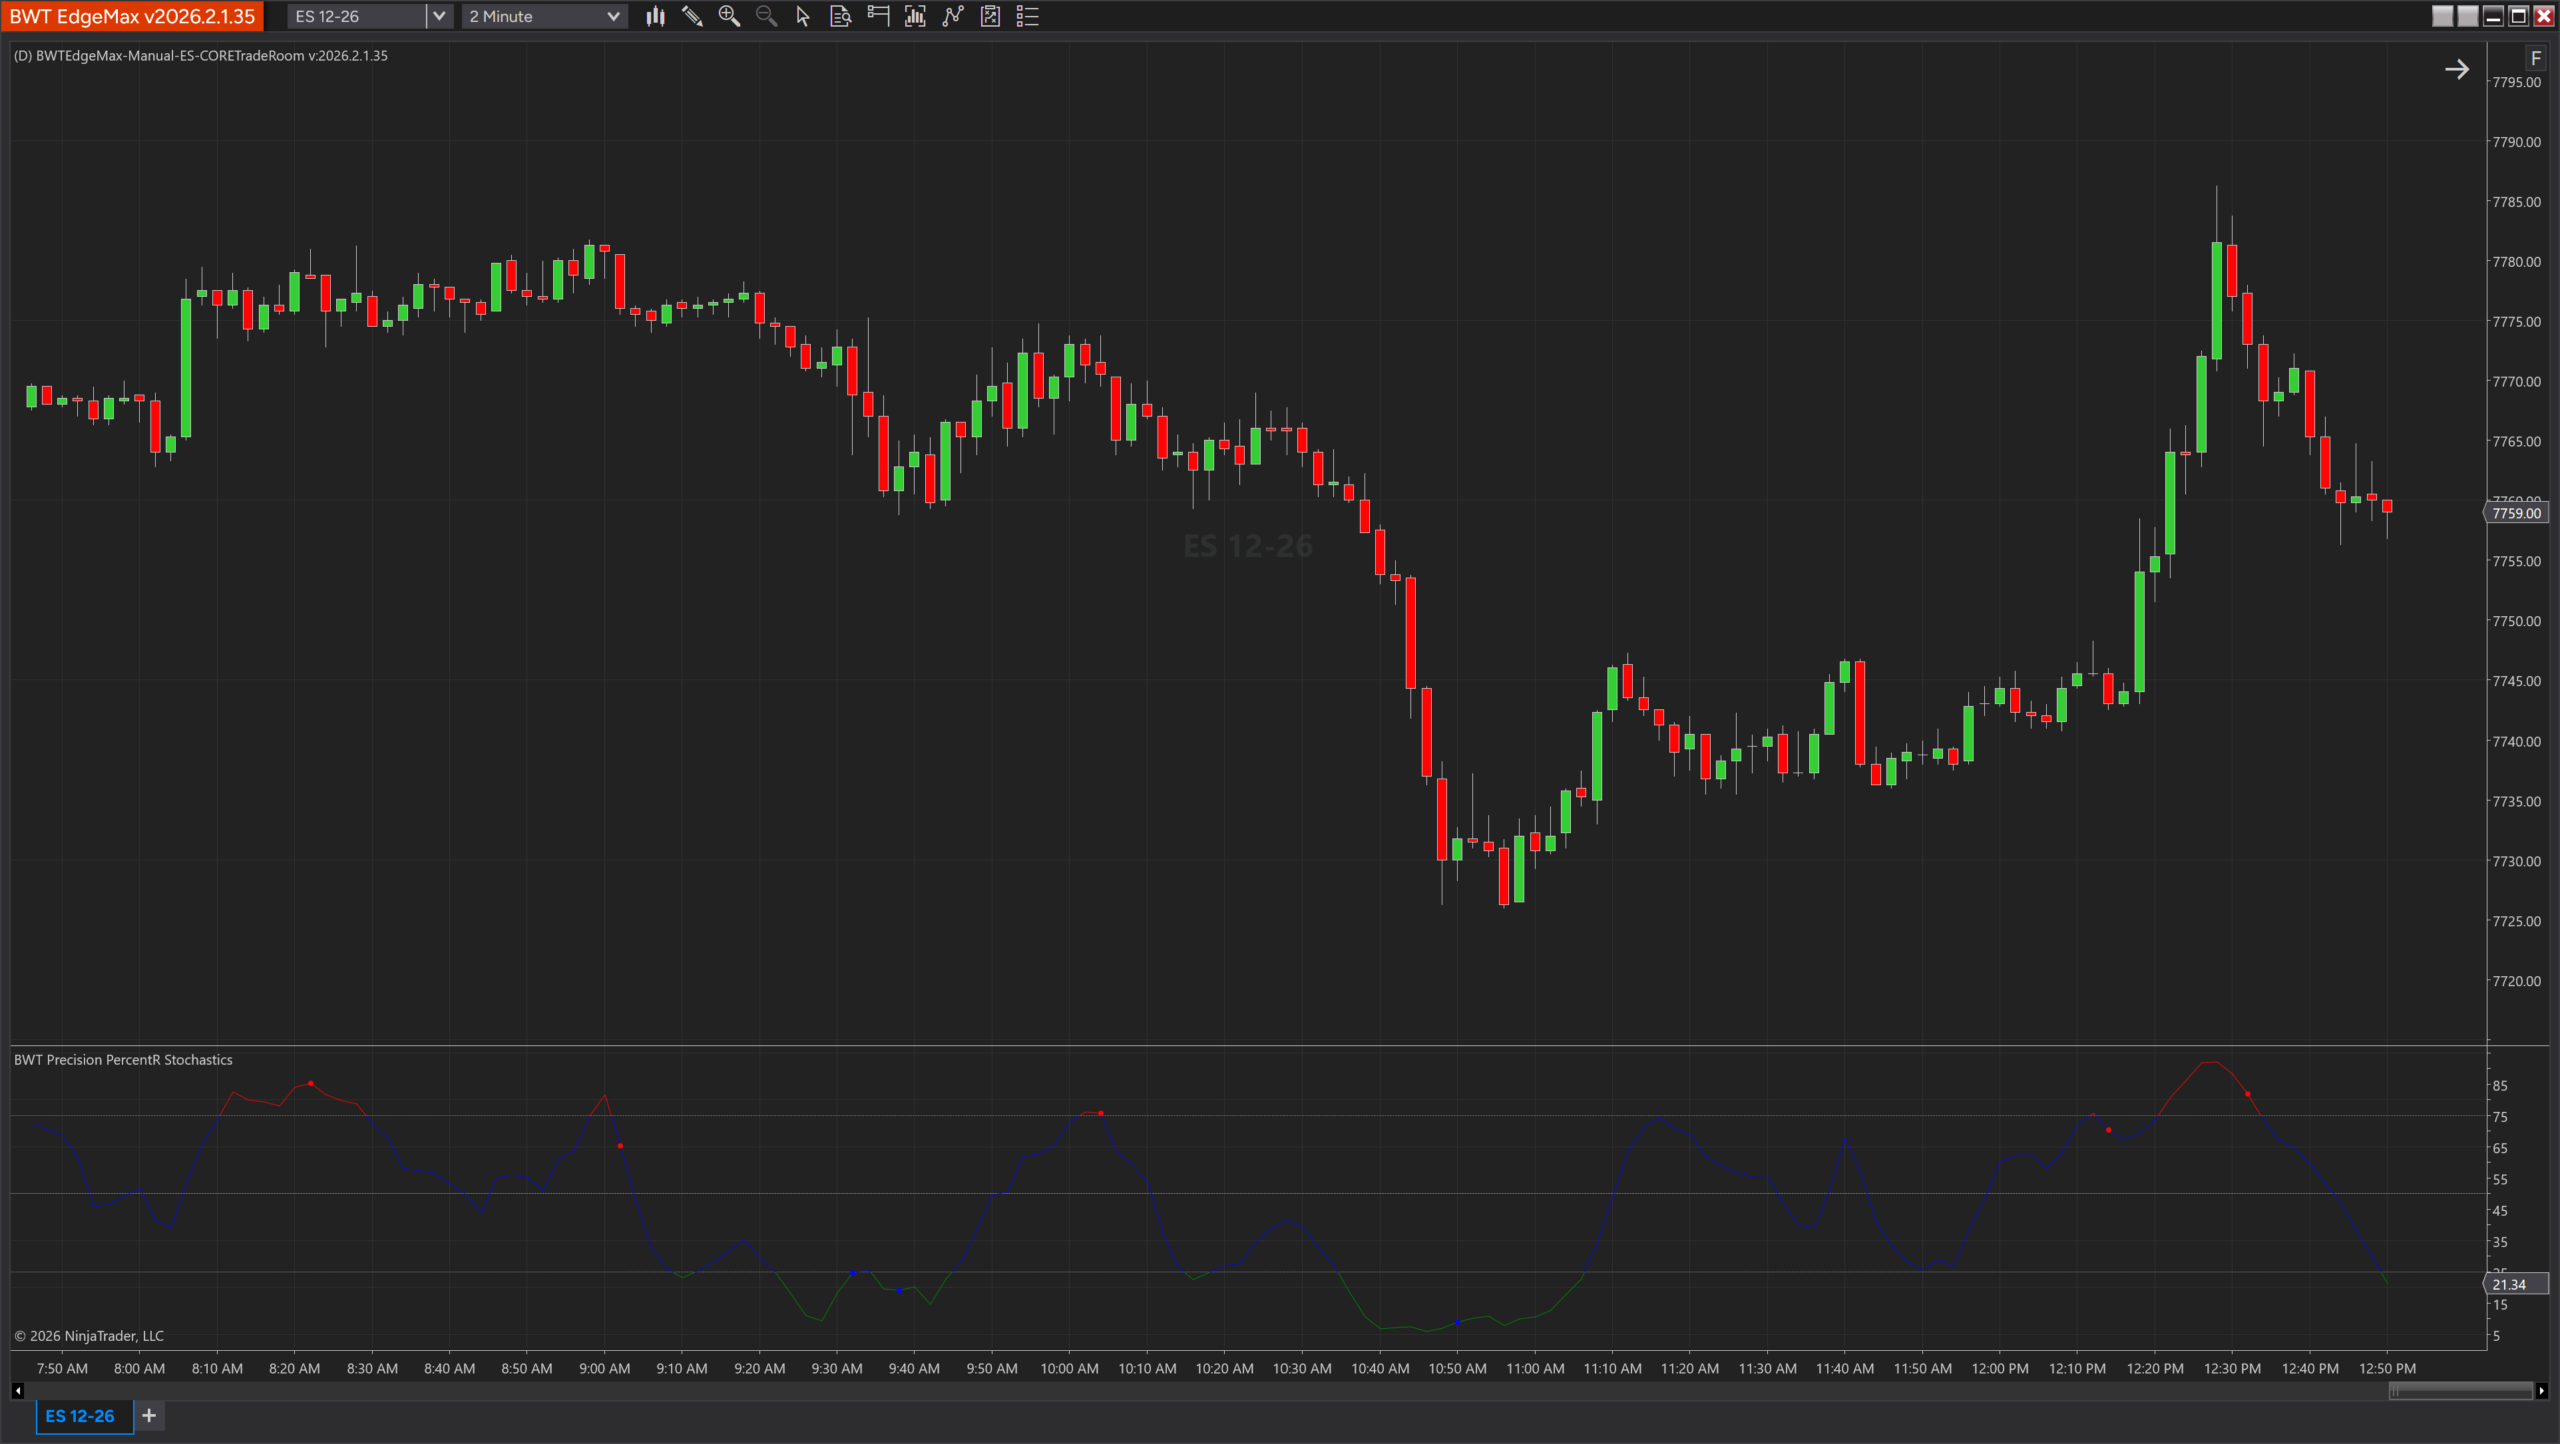
Combines Williams %R with double-smoothed Stochastic. Alert dots mark oscillator reversals from extremes — catching turns before they become trends.
Price Structure &
Levels Suite
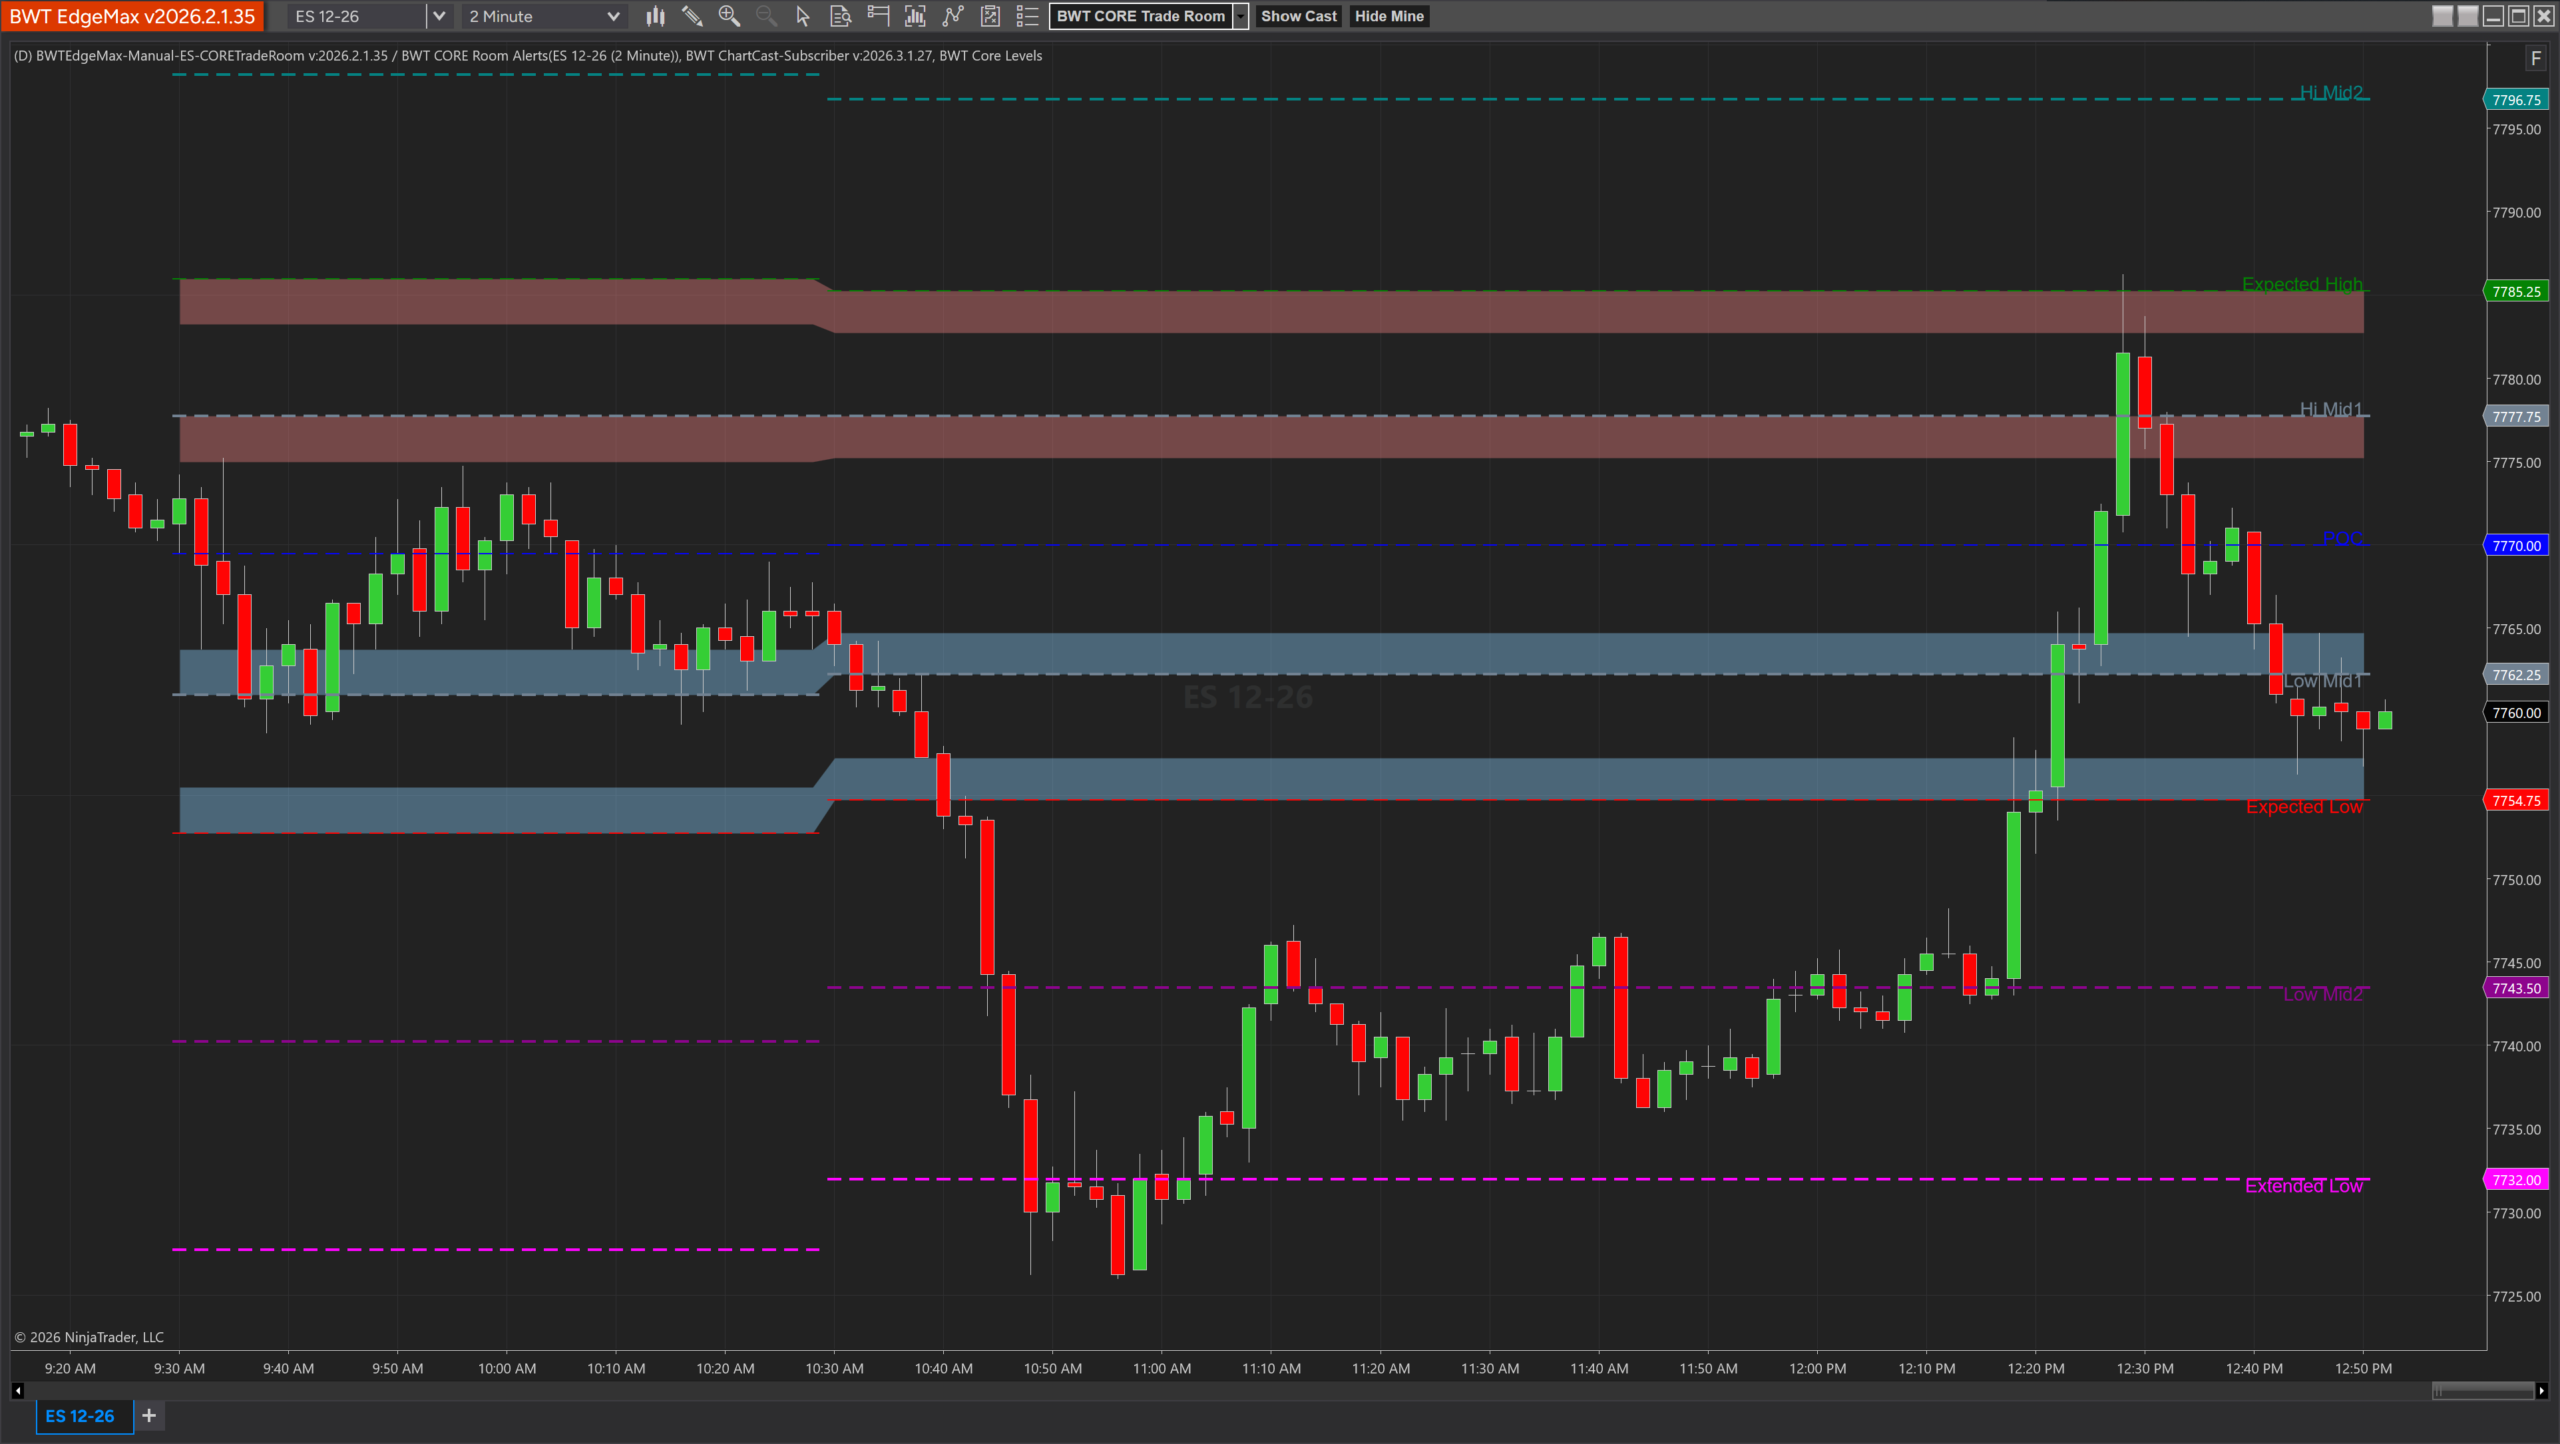
Professional daily range projection built on proprietary overnight session analysis. Projects expected range highs and lows, extended range extremes, midpoint bias levels, and the POC — all with statistical probability context. Also available standalone →
Tracks three distinct Globex session ranges (3:00 AM, 8:30 AM, 9:30 AM) with color-coded shaded zones and labeled session boundaries. See exactly where overnight price discovery occurred.
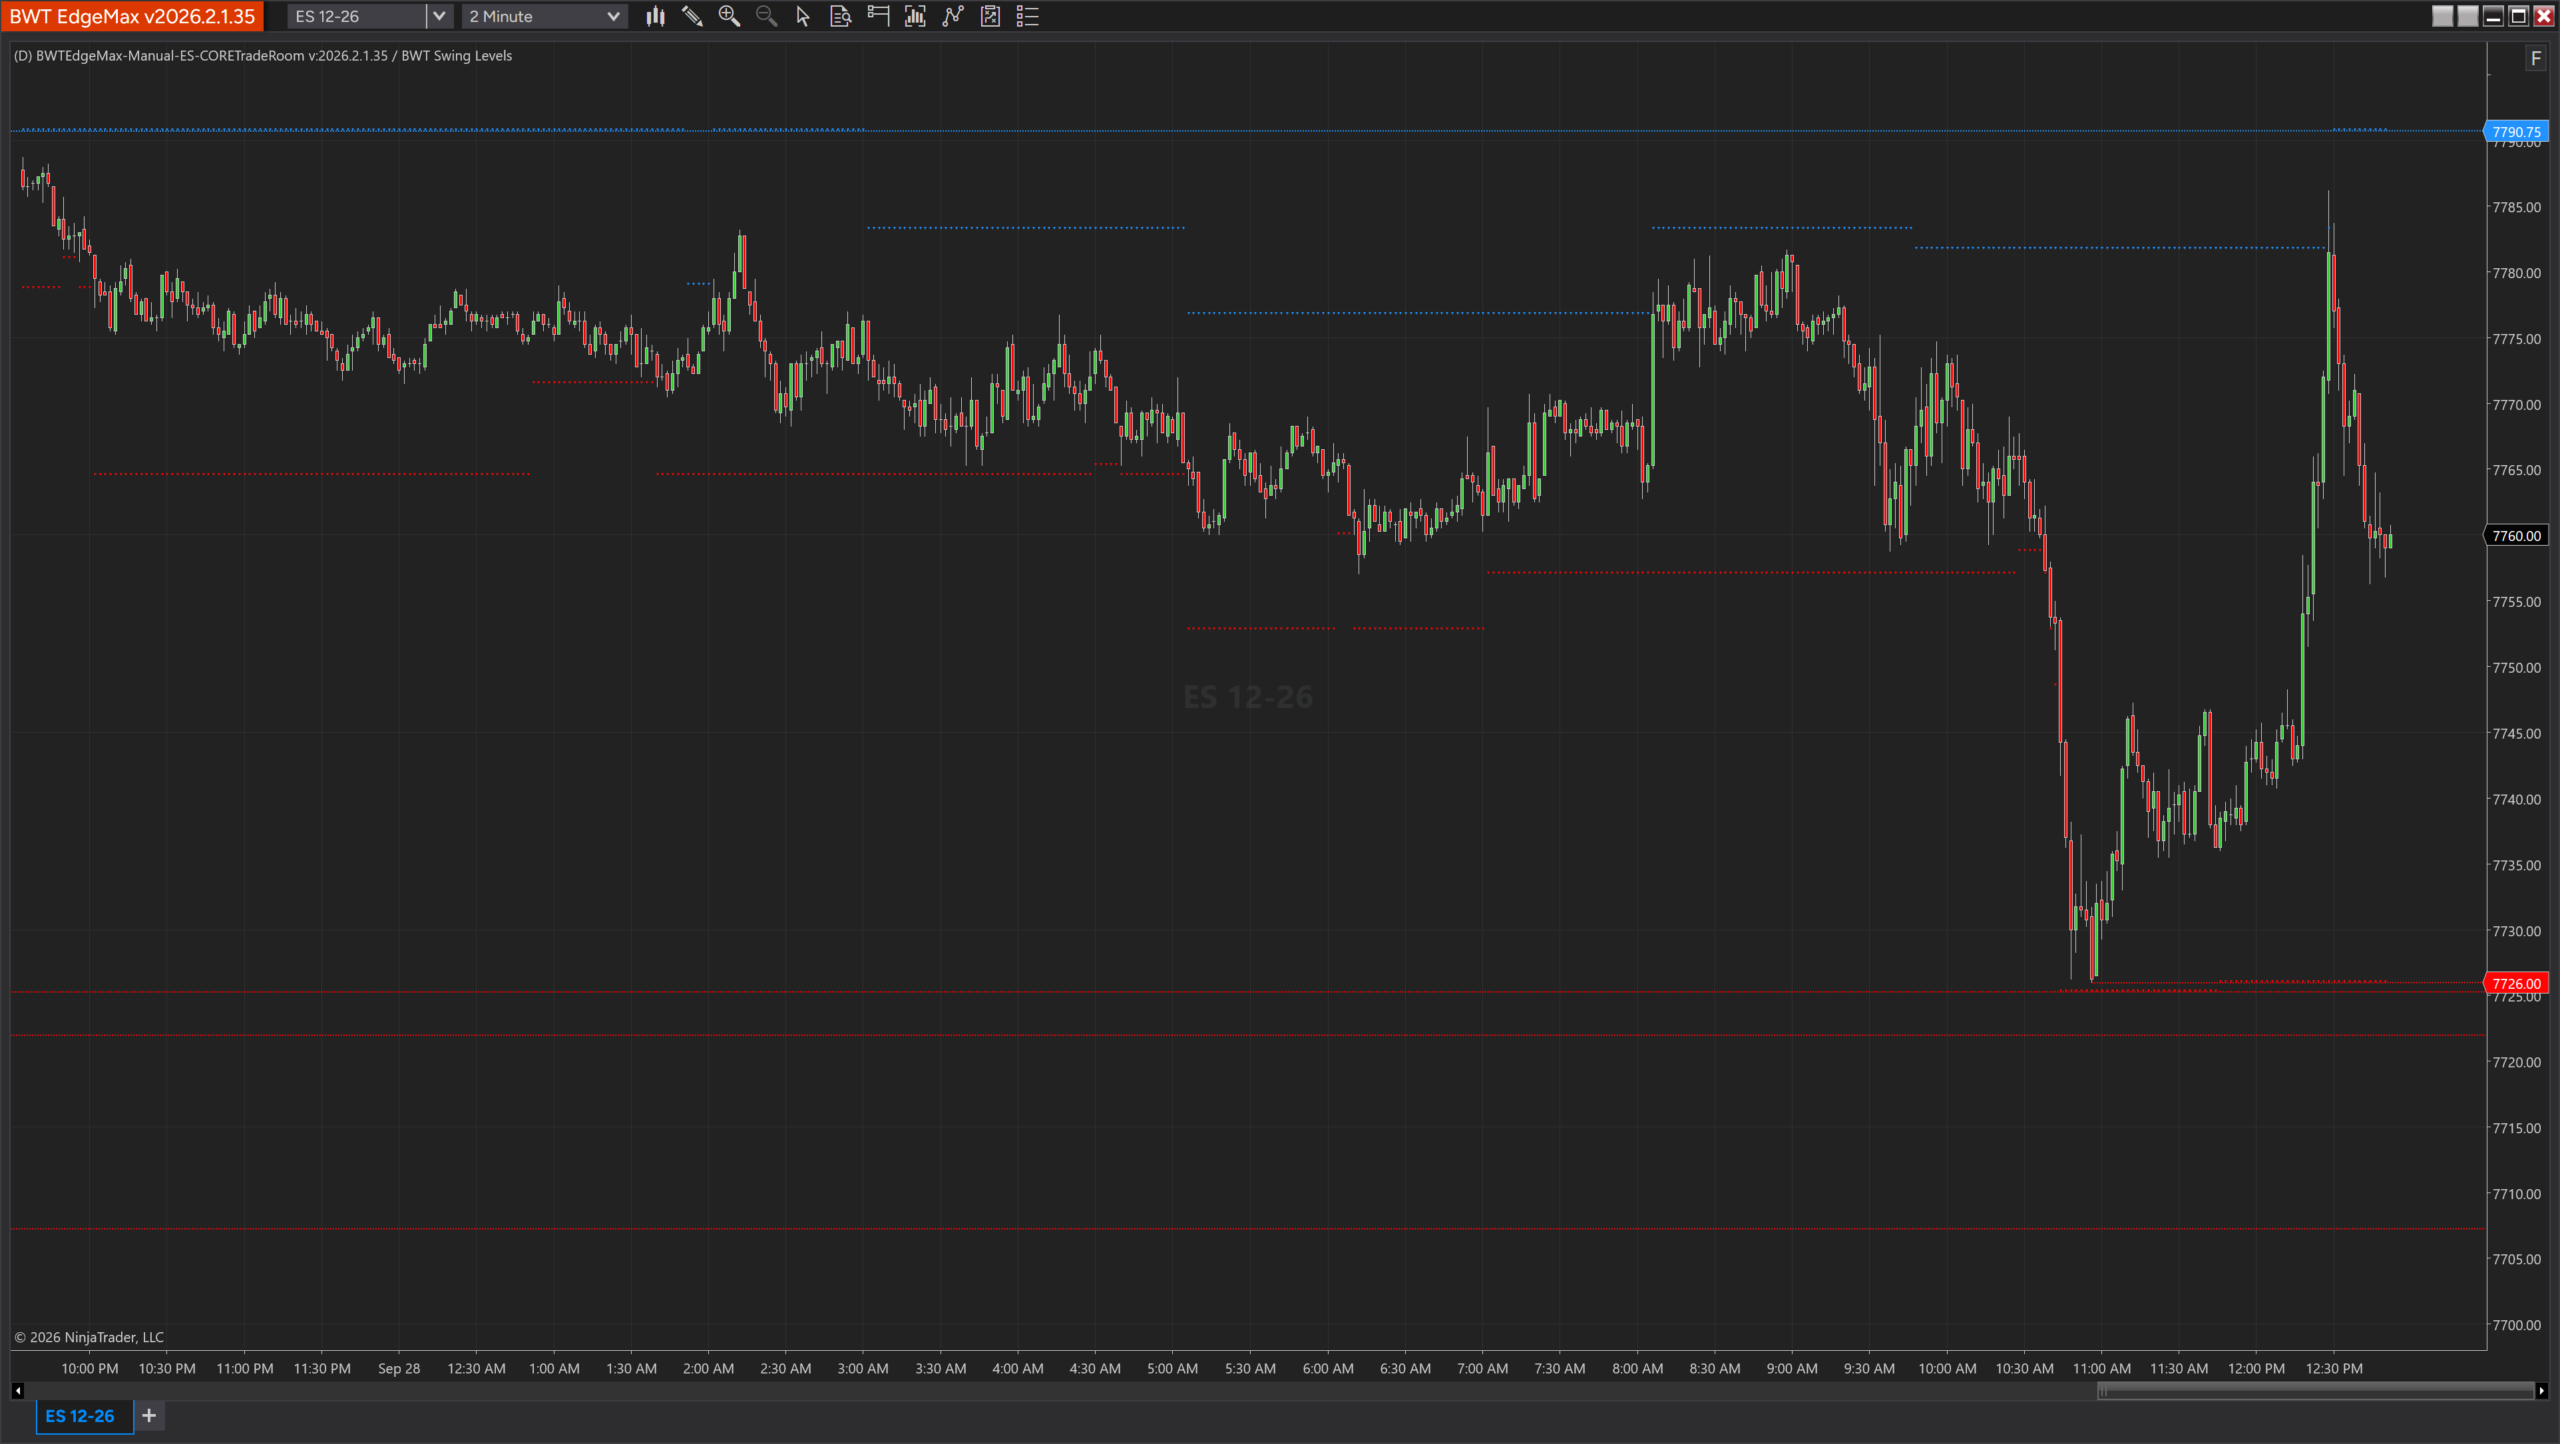
Session levelsIdentifies swing highs and lows, then draws horizontal support/resistance rays that auto-remove when price breaks through. A clean, dynamic map of the levels that matter right now.
Volume profile and Value Area visualization. Supports VOC, TPO, VWTPO, and VTPO profile types. Plots POC line and Value Area bands that evolve throughout the session.
Volume profilePremium
Analysis Suite
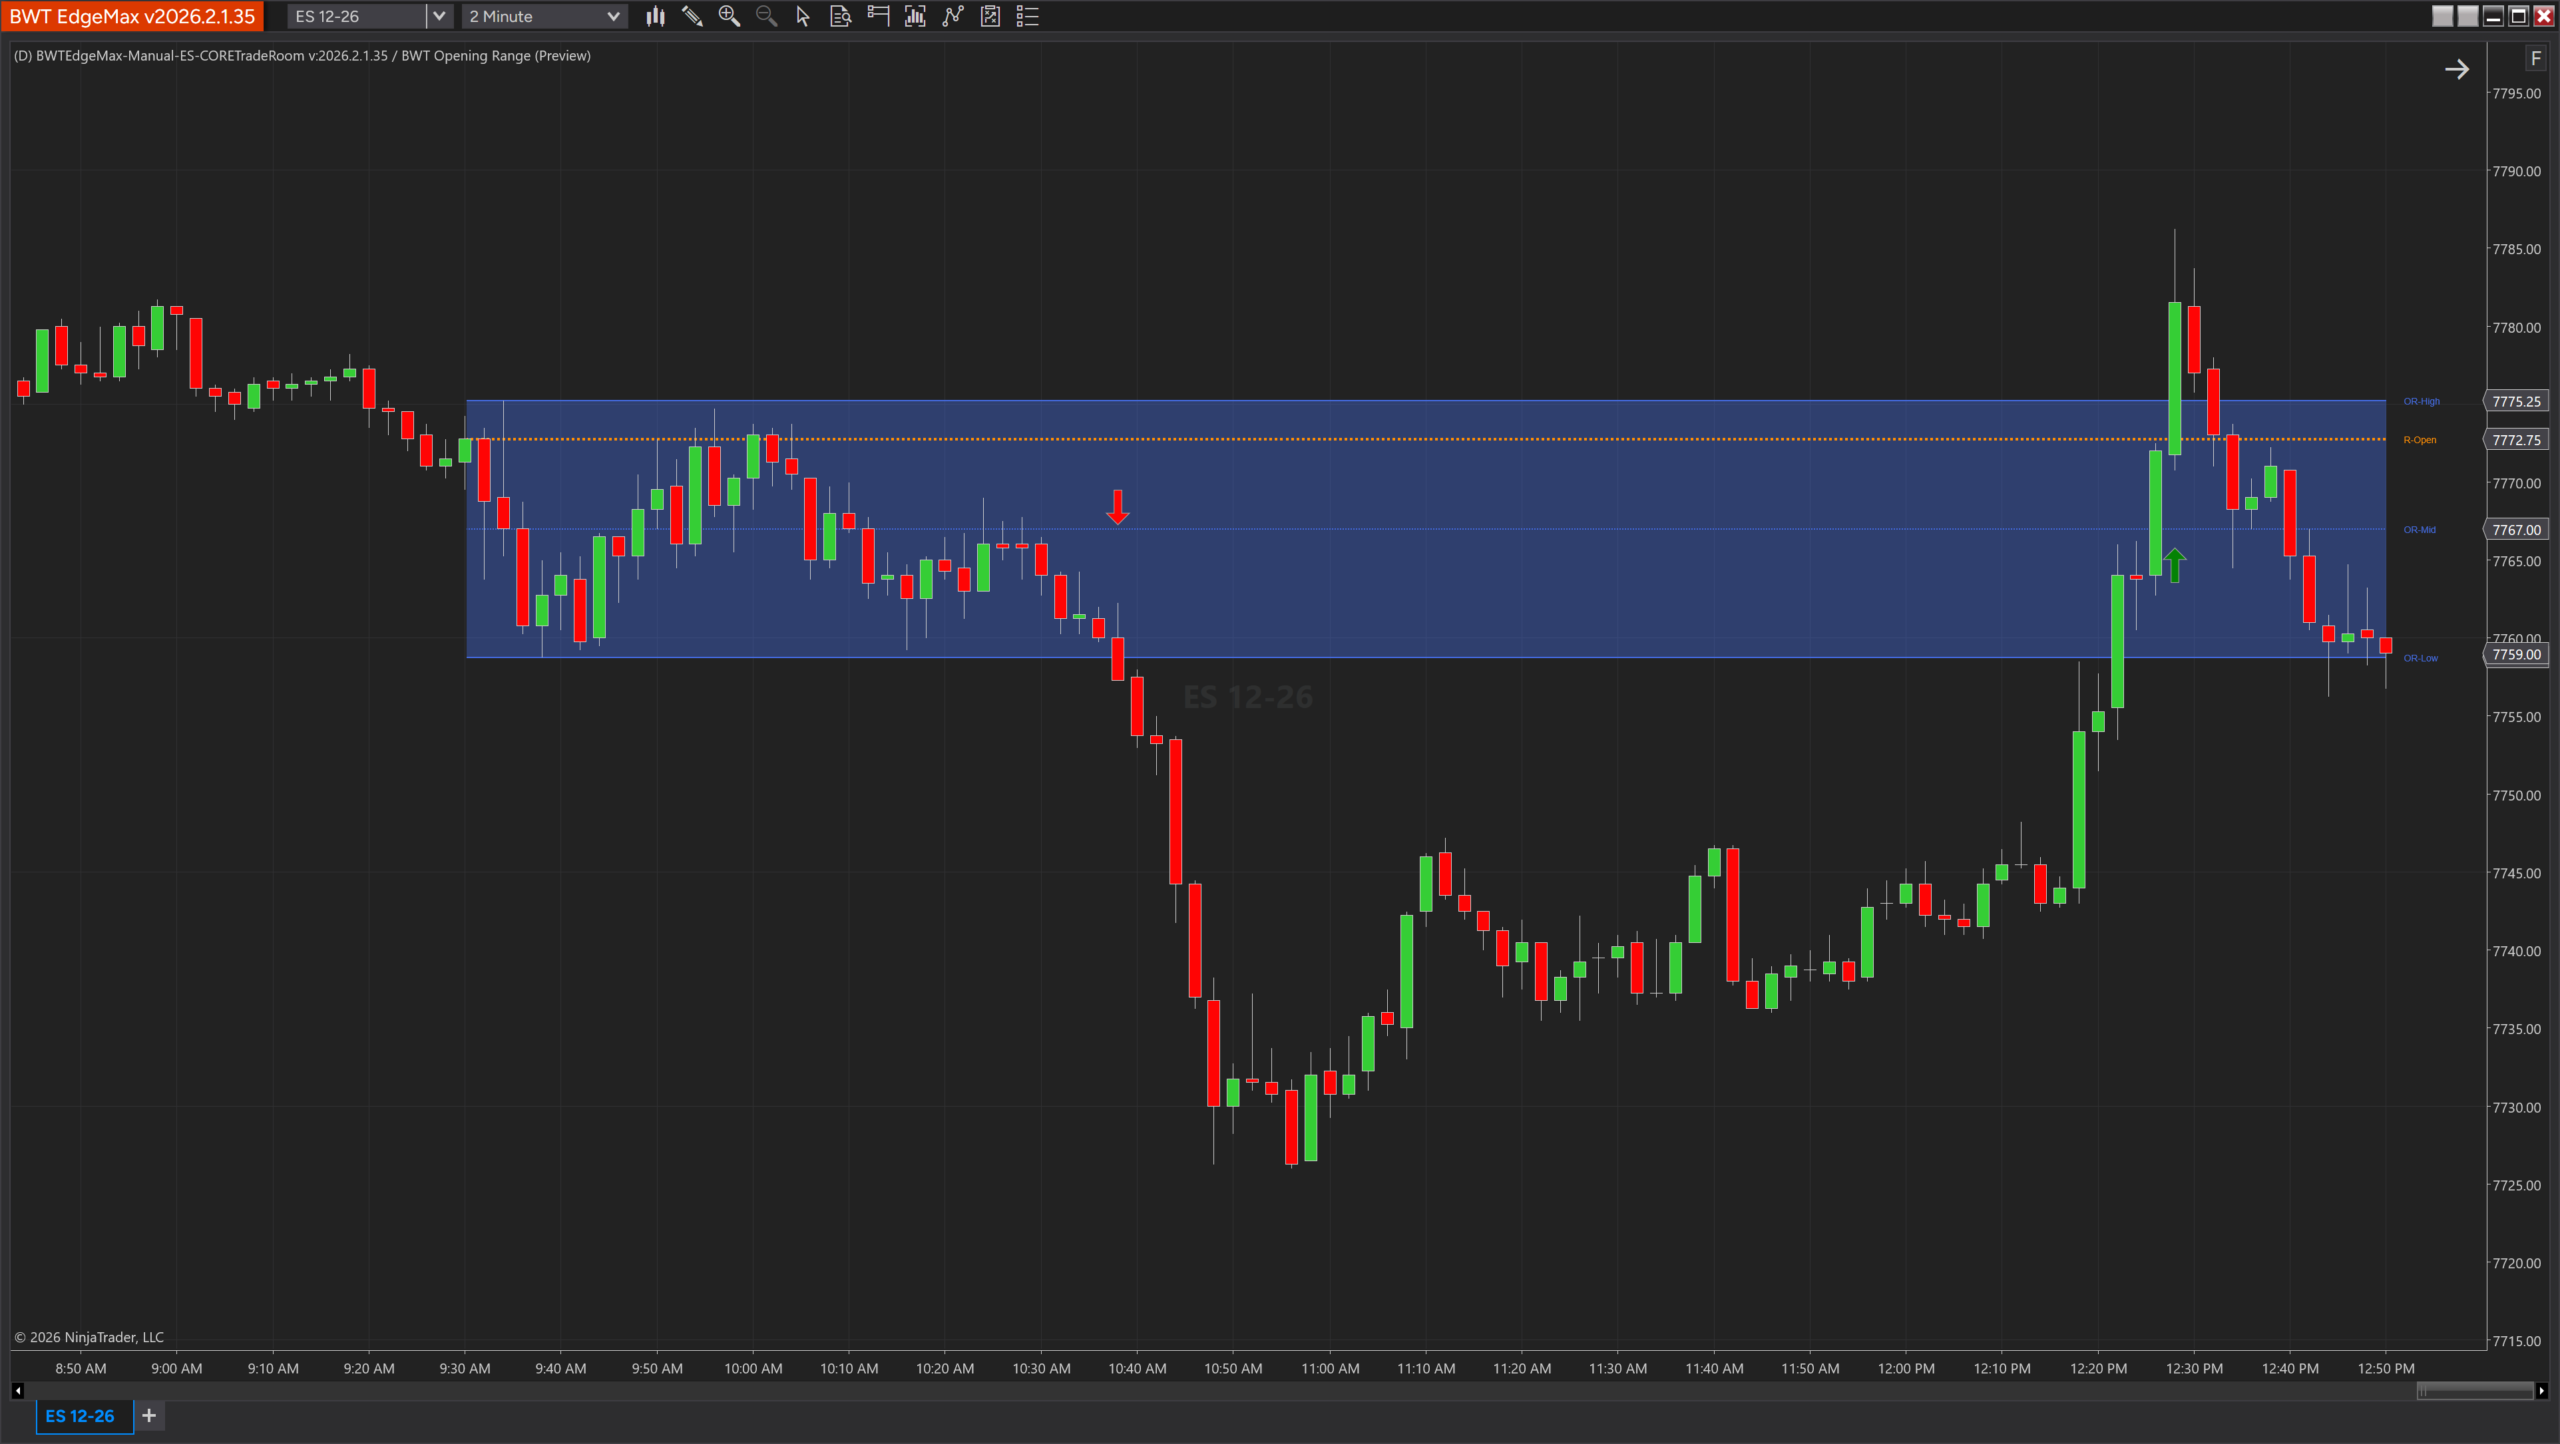
Opening Range Breakout indicator. Plots session open, OR high/low, midline, pre-session range, and entry signals based on breakout and pullback validation. Configurable session times, pullback mode, and min/max OR size.
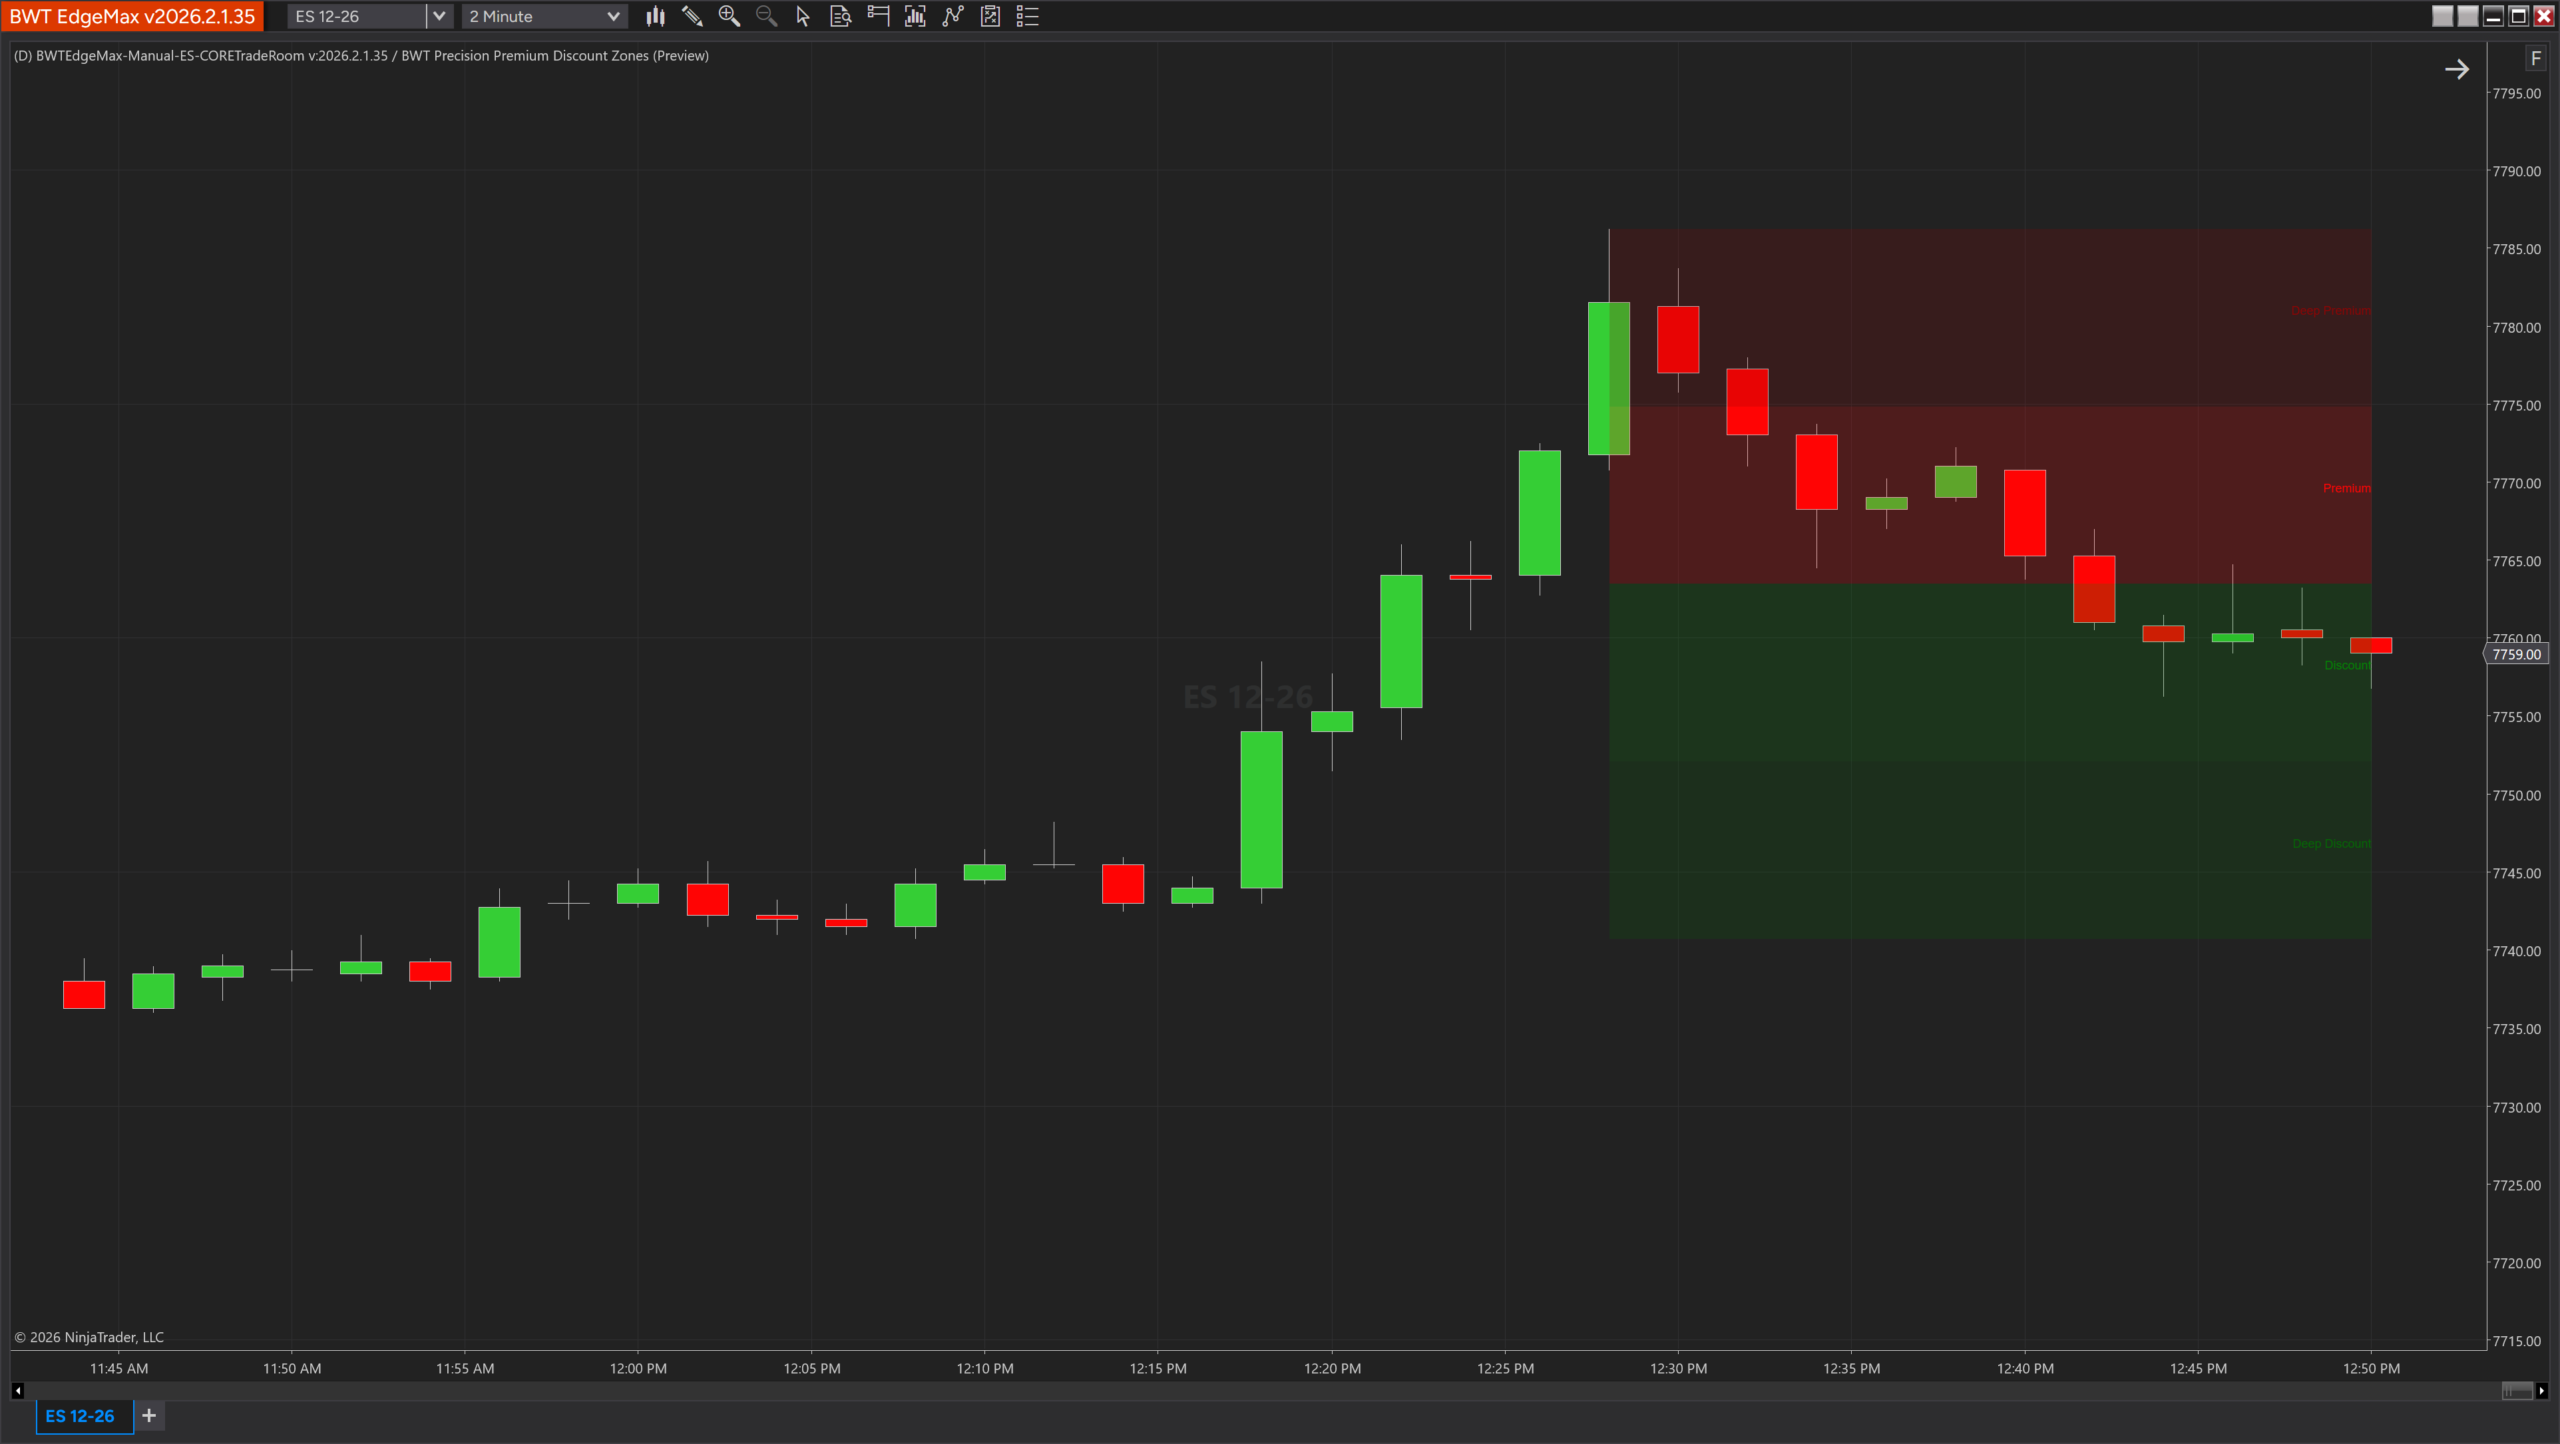
Swing-based supply/demand mapper creating four quadrant zones between swing extremes: Deep Discount (0-25%), Discount (25-50%), Premium (50-75%), Deep Premium (75-100%). Optional multi-timeframe support.
Session range tracker that calculates historical daily ranges and plots current session progress as percentage milestones (25%, 50%, 75%, 100%, 125%, 150%, 200%). Know how far today's range has extended relative to history.
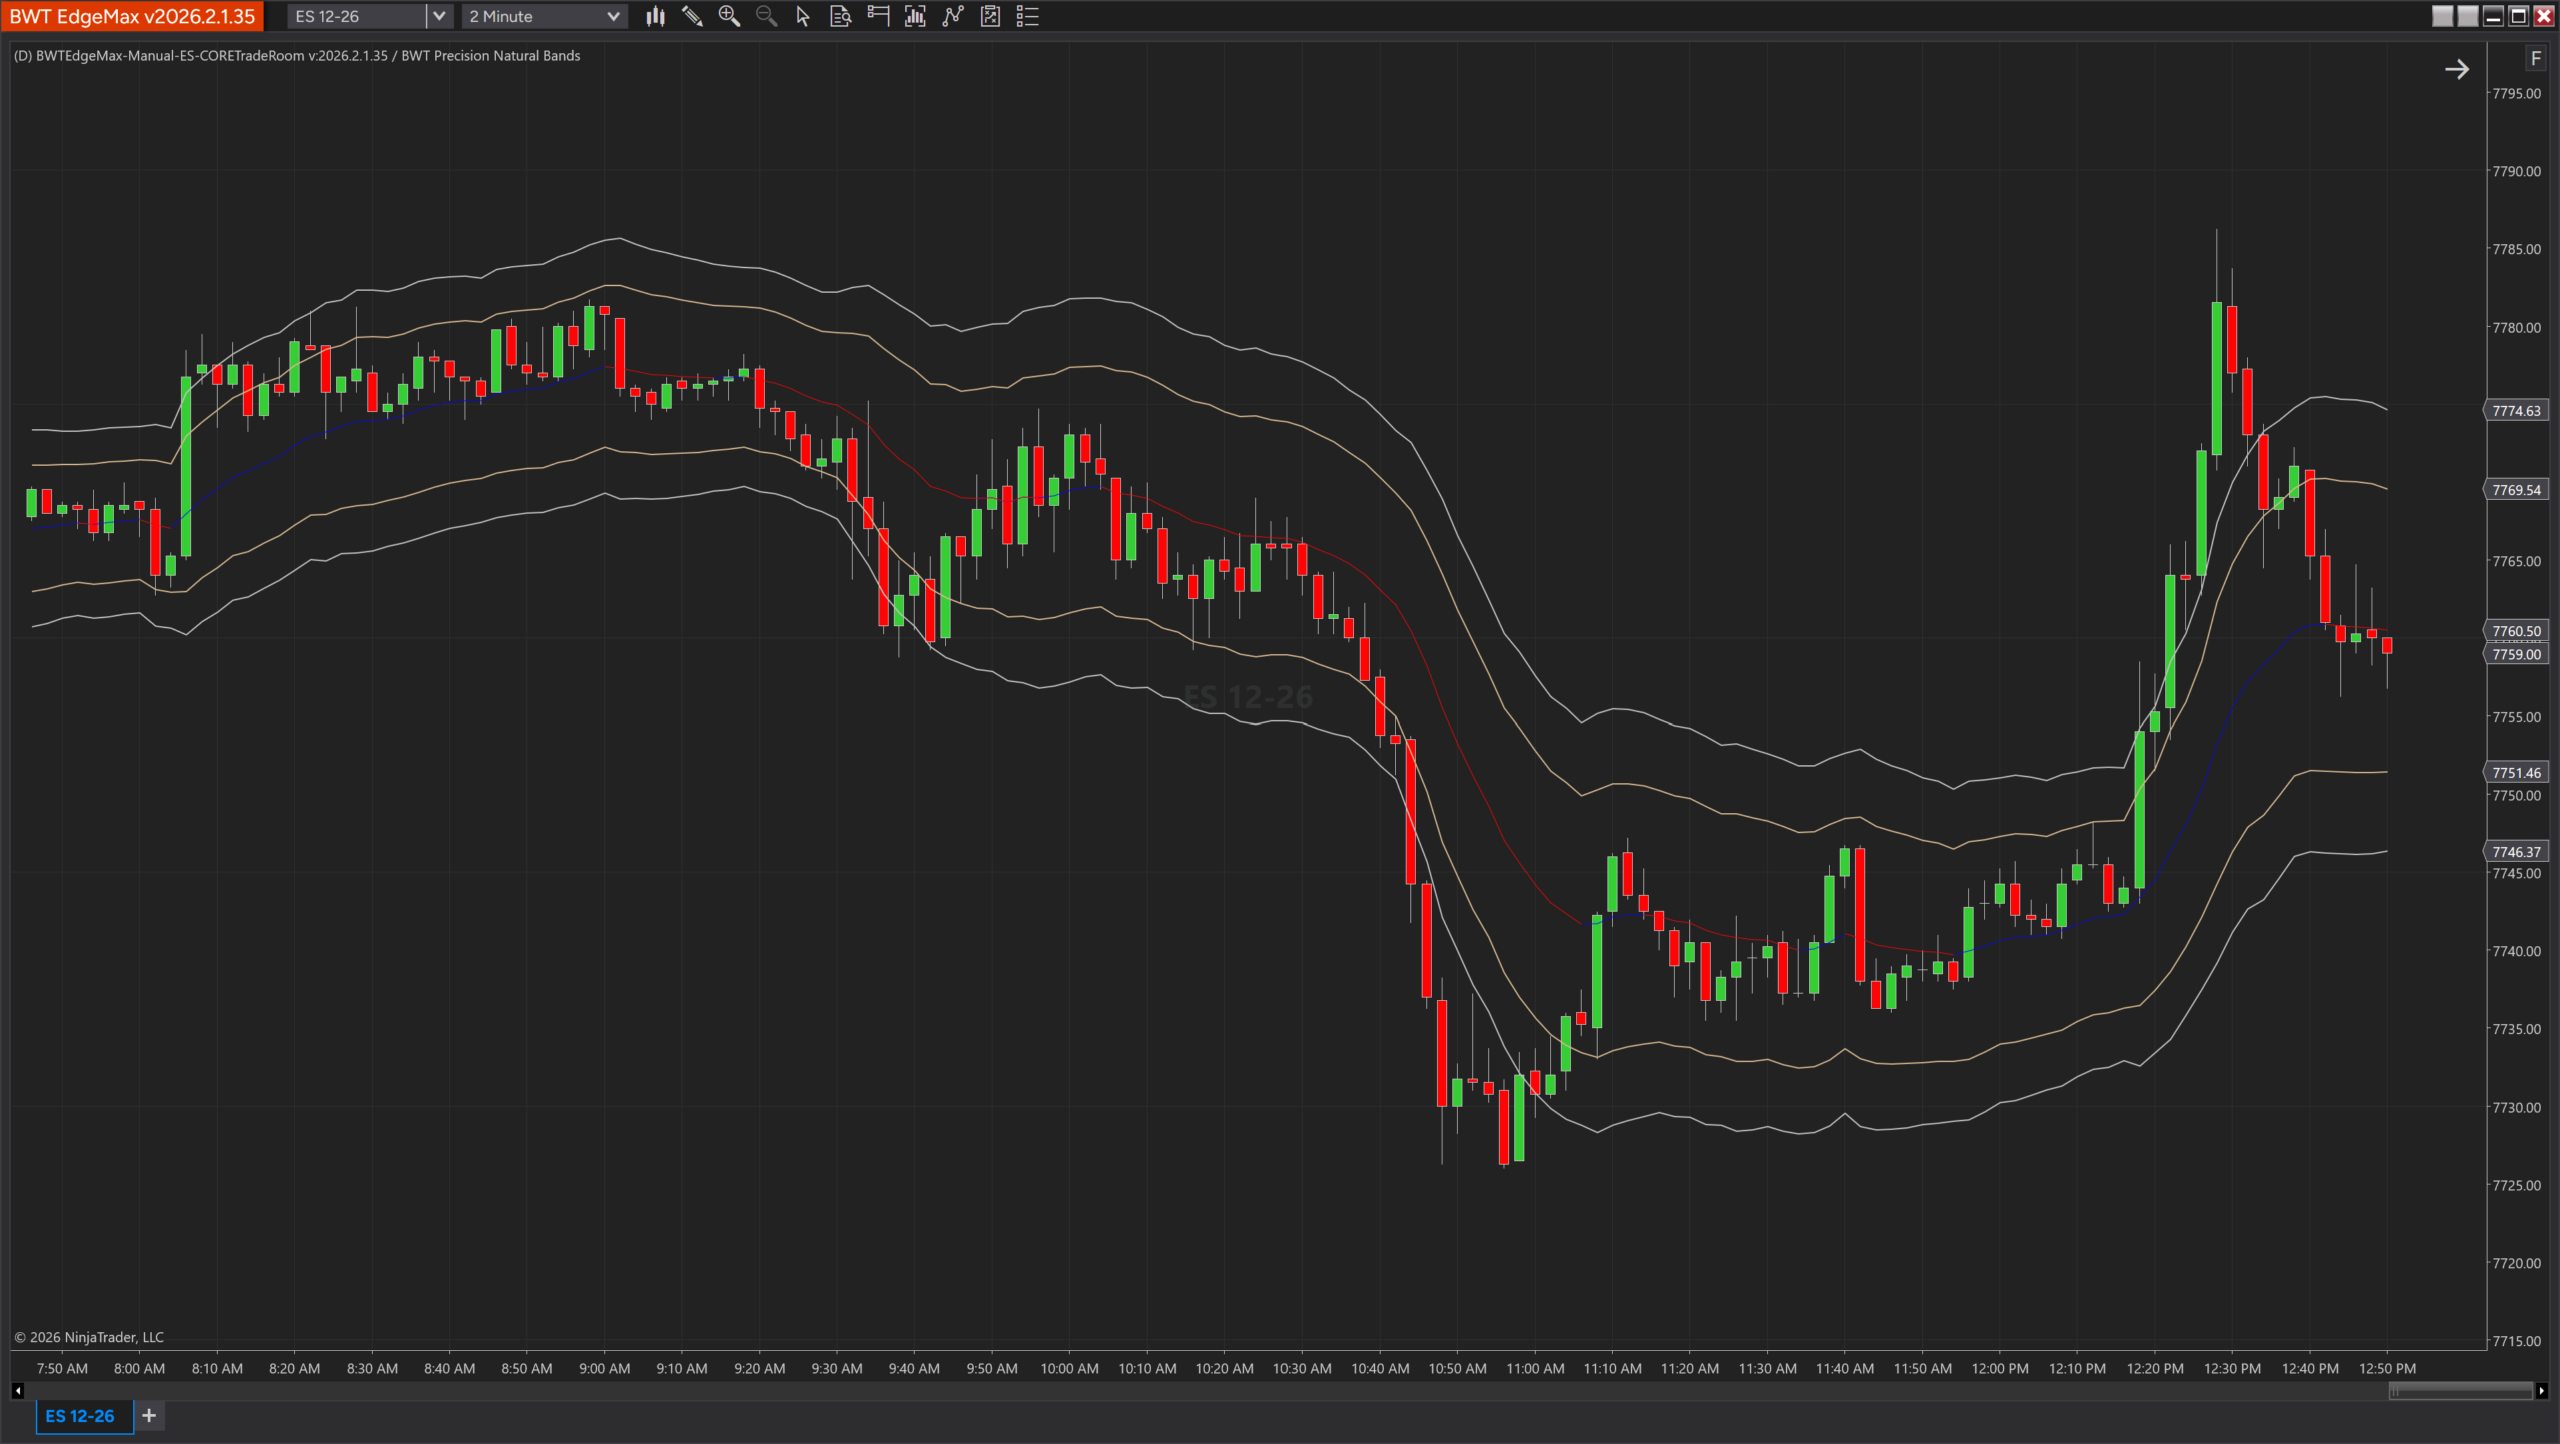
Range trackingDynamic volatility bands around an adaptive EMA centerline using True Range. Plots inner bands and extended bands with trend-colored midband — blue rising, red falling. A volatility envelope that adapts in real time.
Price Action &
Volume Suite
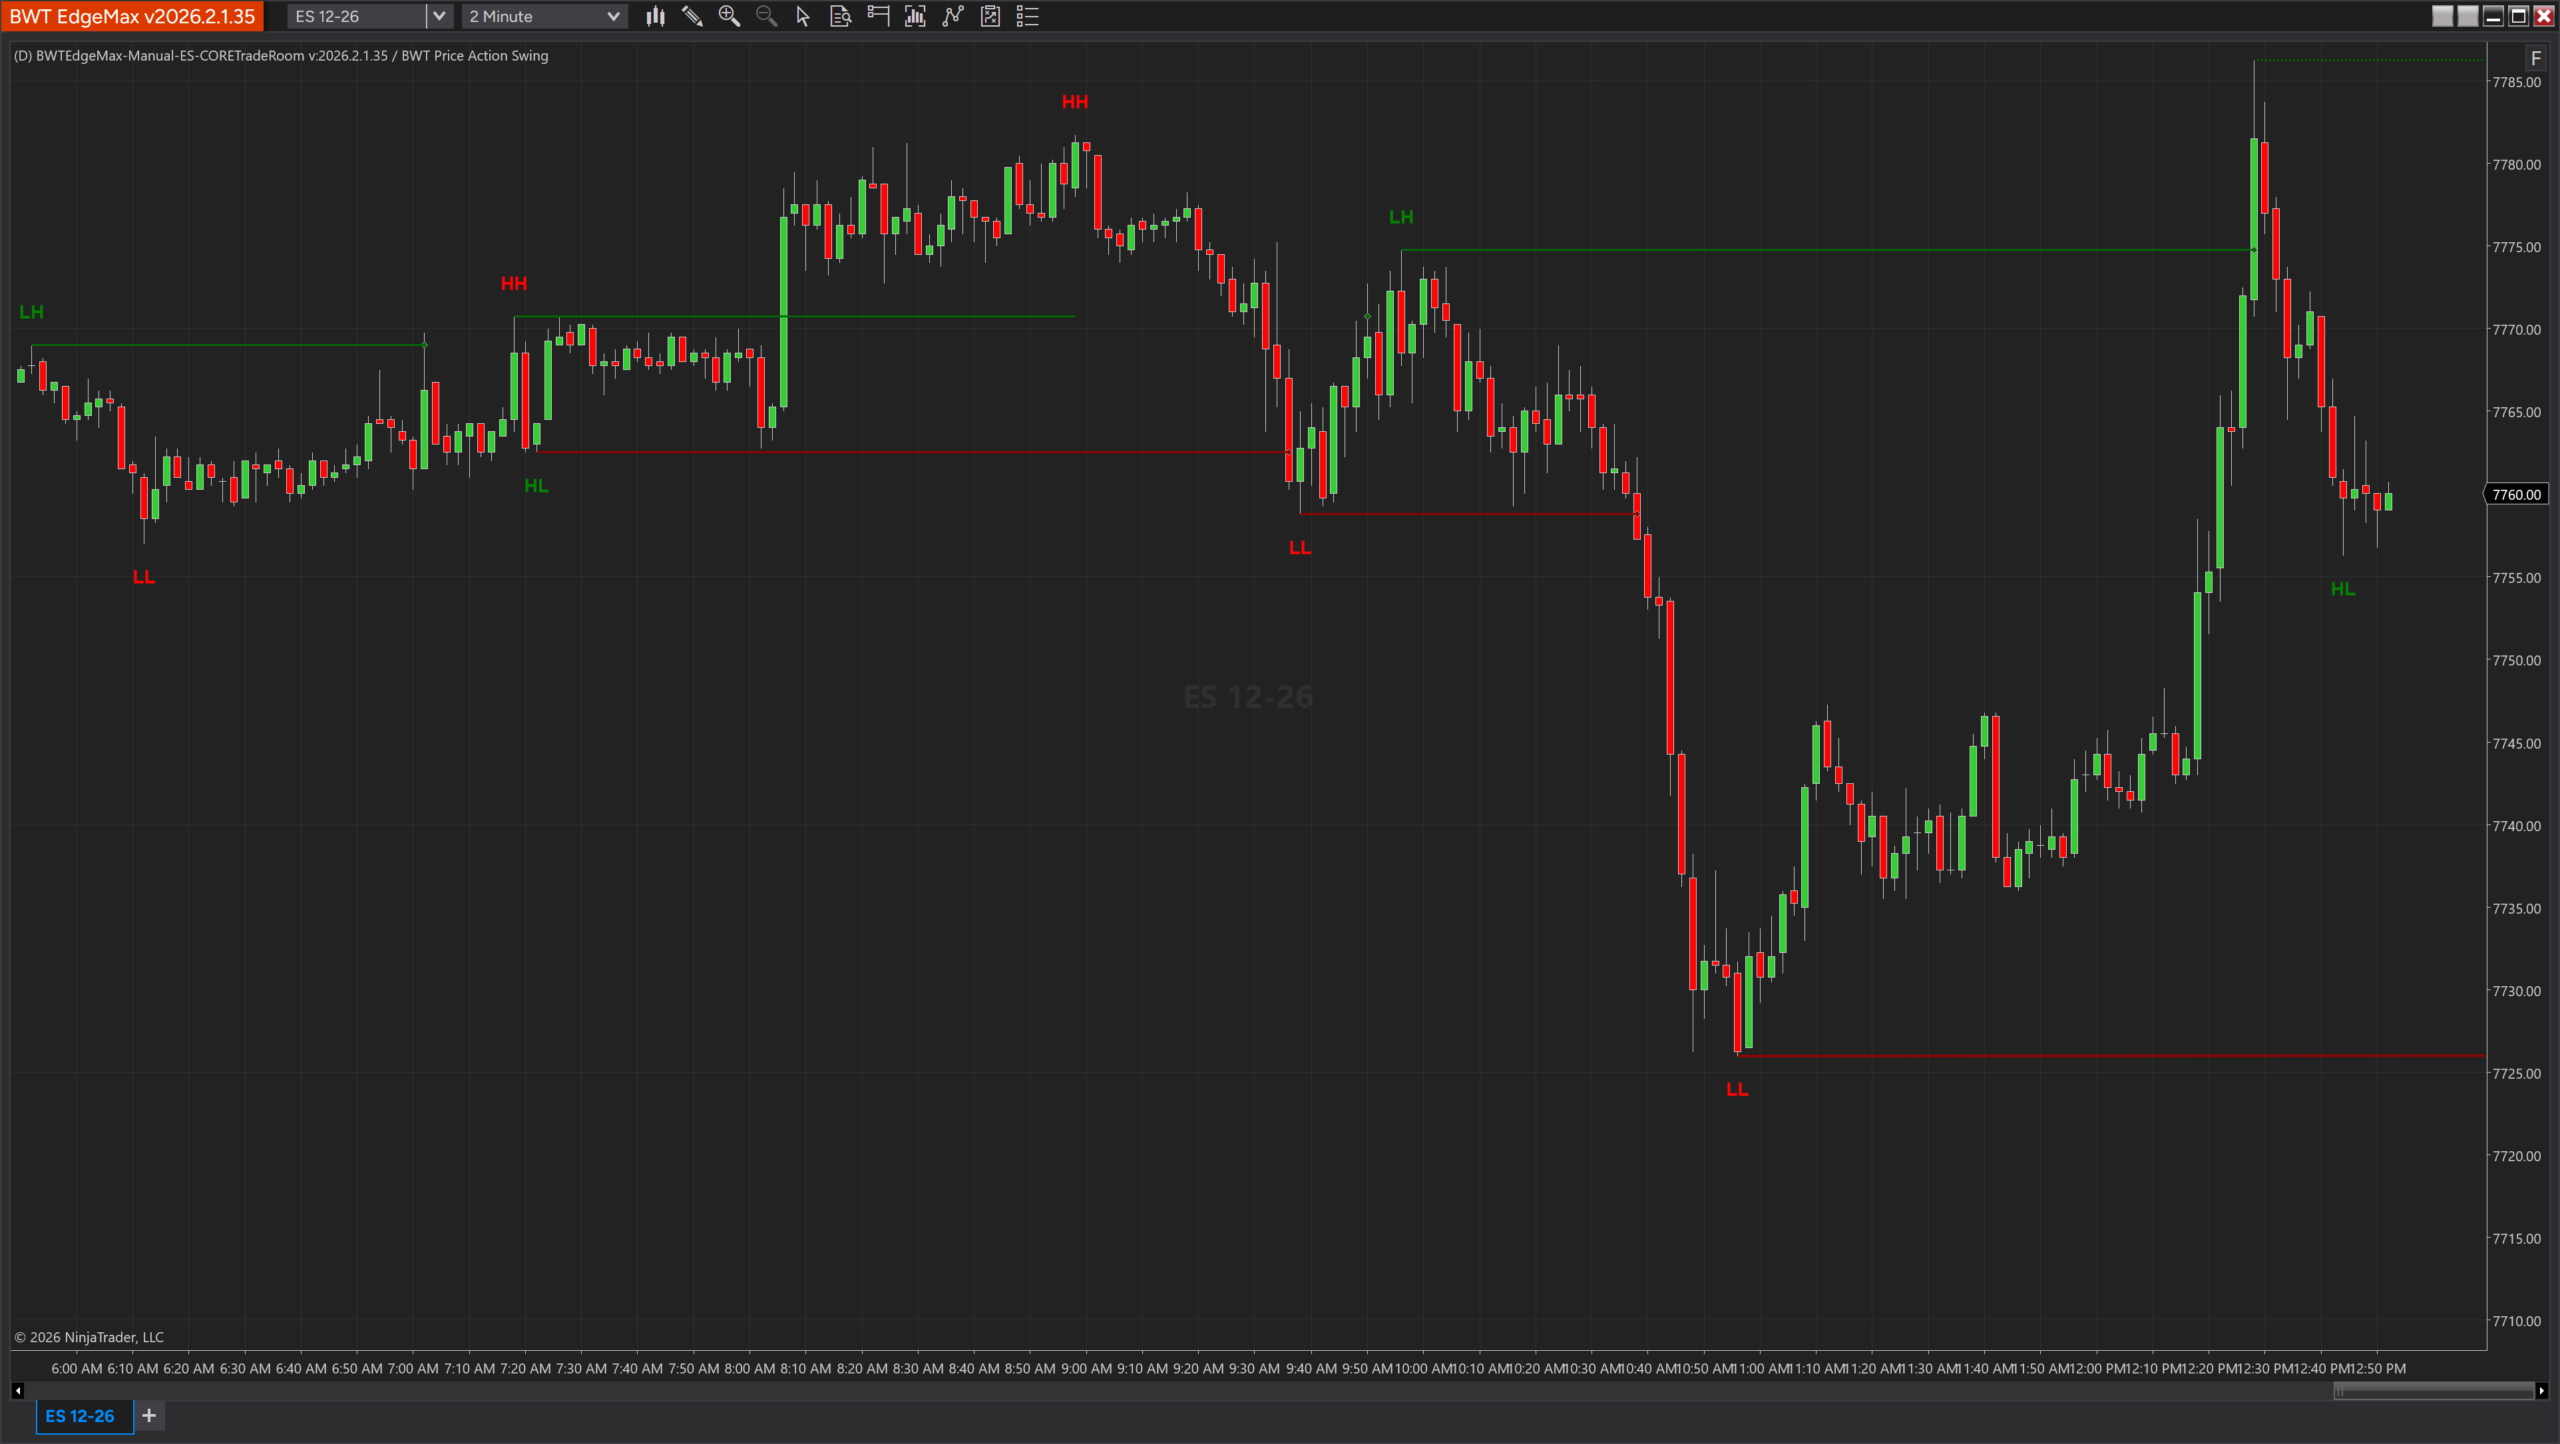
Professional swing analysis with double-top/bottom pattern recognition and Keltner minor trend confirmation. Labels Higher Highs, Lower Lows, Double Tops, and Double Bottoms automatically.
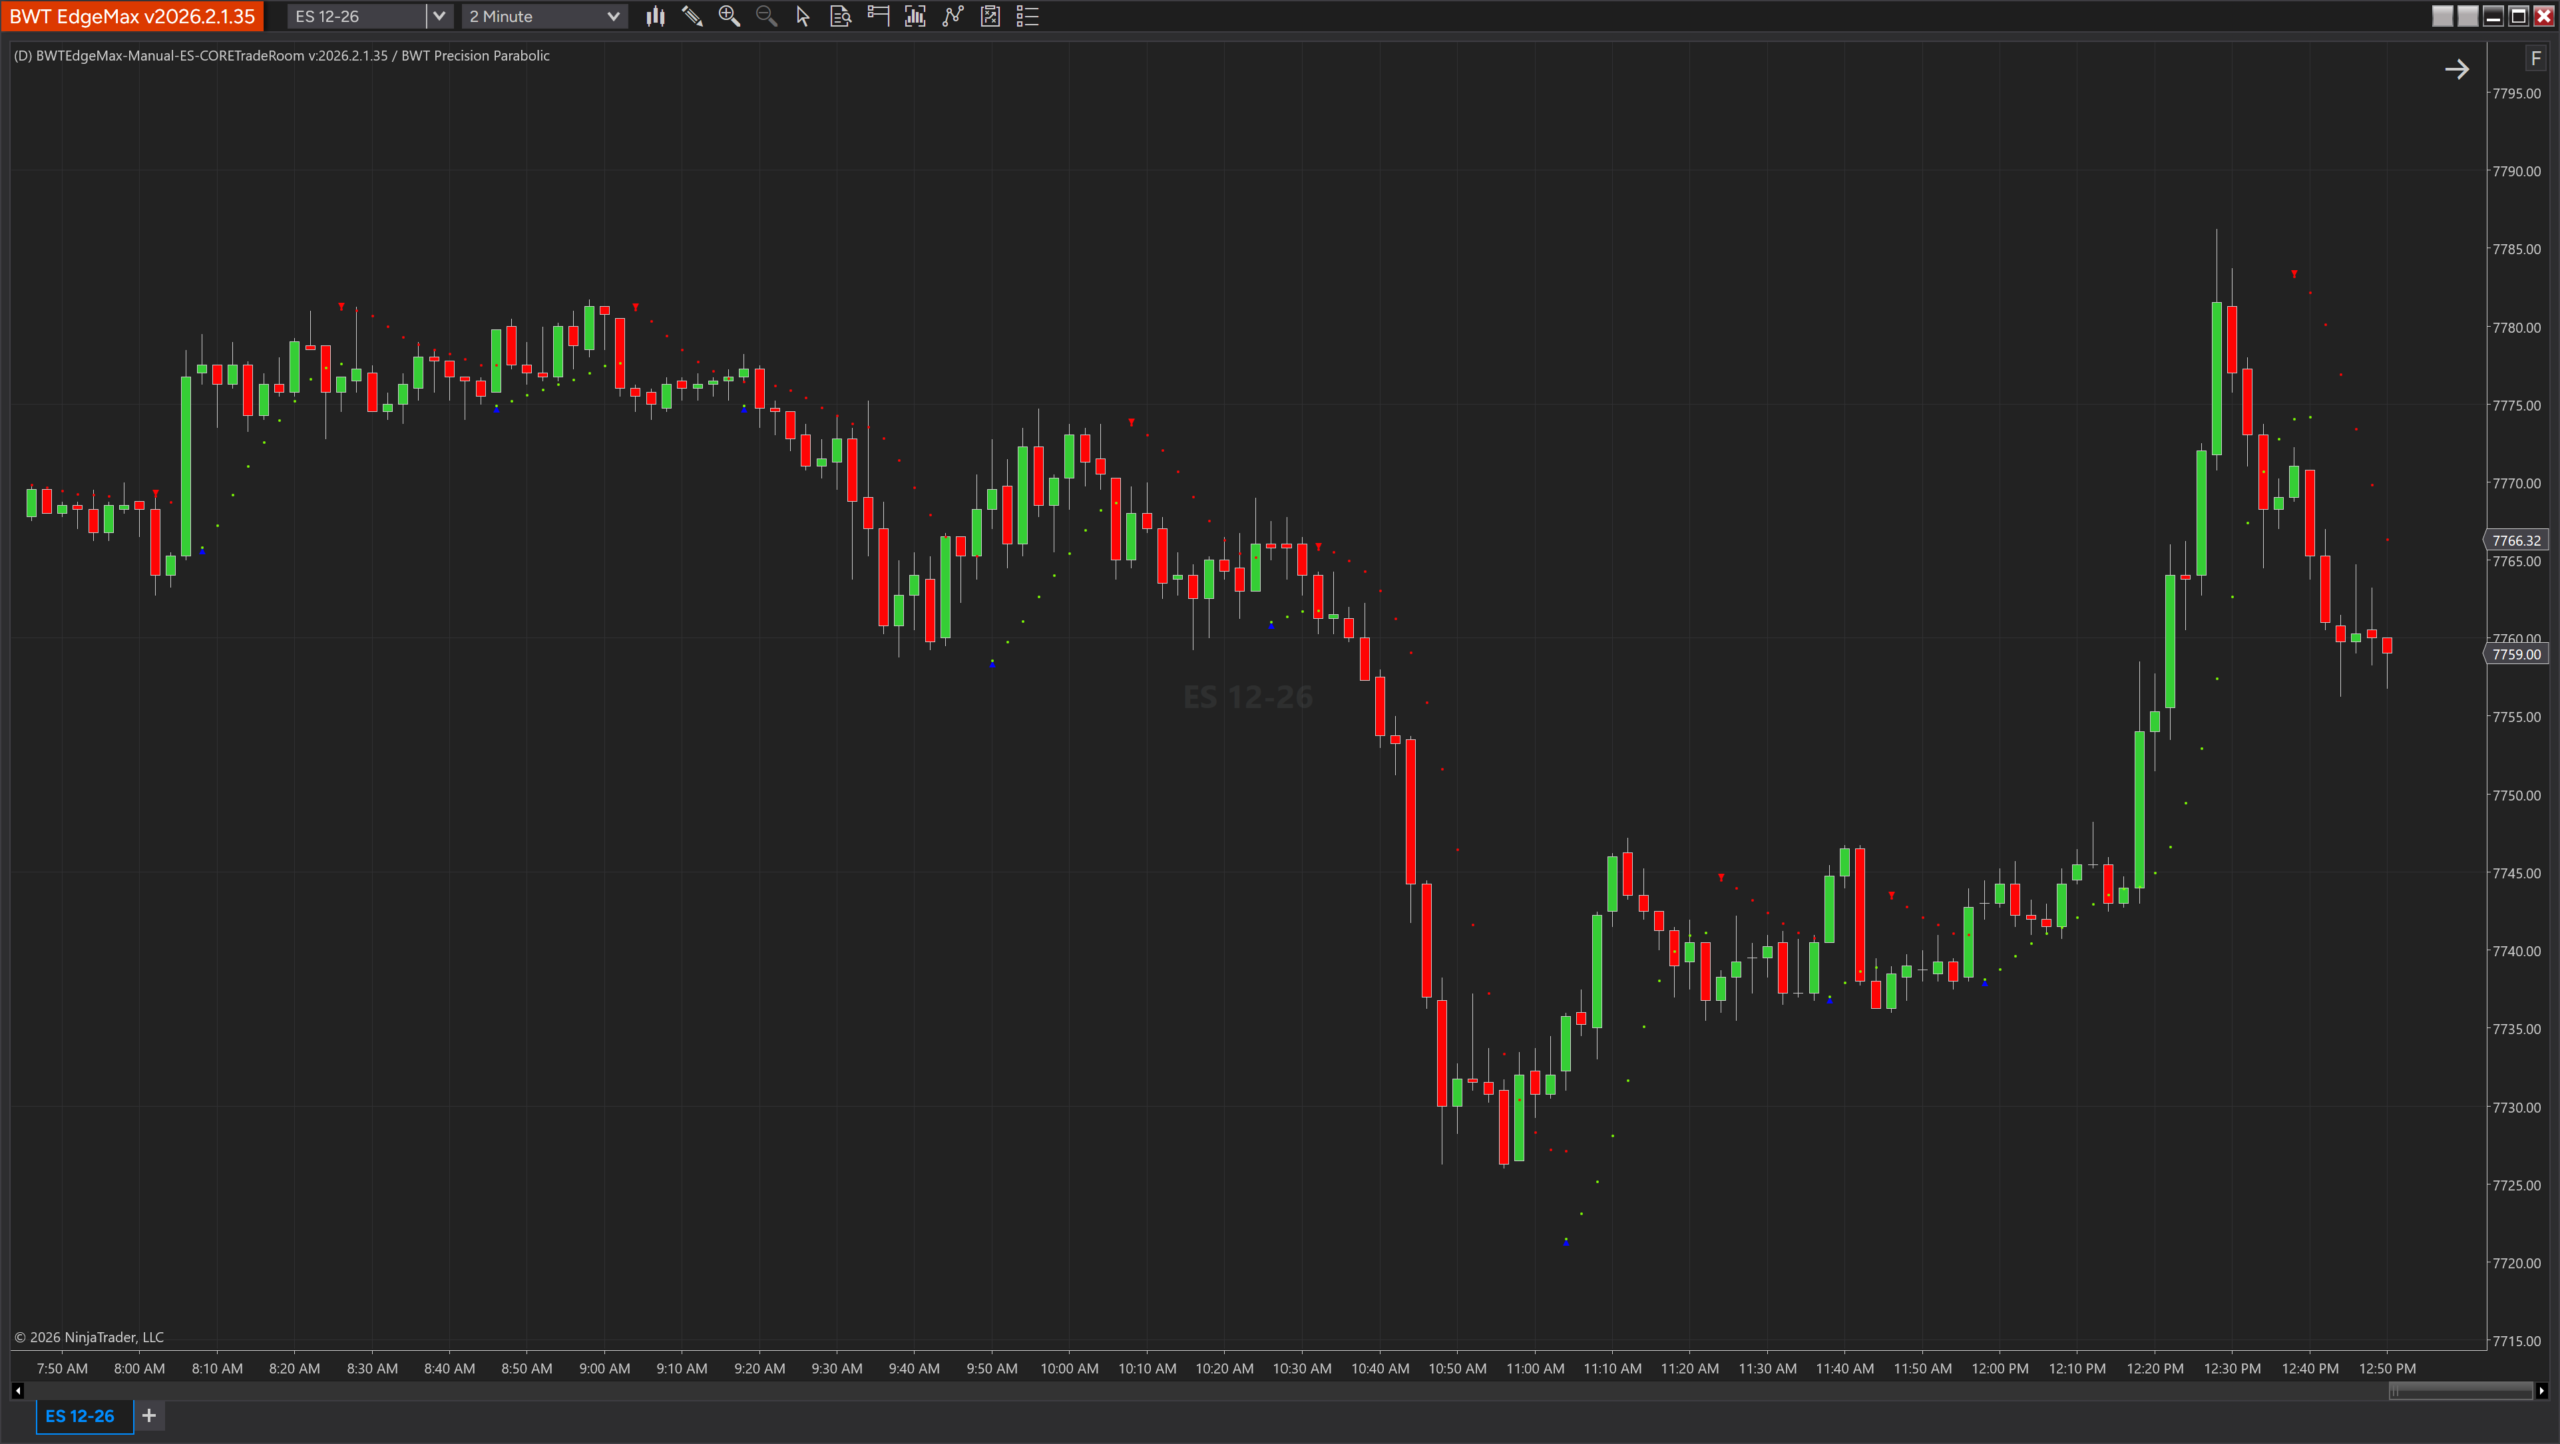
Momentum reversal system using Hull MA derivatives. Plots confirmation signals, BuyStop/SellStop levels, and horizontal reference lines that reset on trend changes. Catches momentum shifts early.
Detects reversals where volume direction contradicts price direction at swing extremes. Buy signals at swing lows with down-volume, sell signals at swing highs with up-volume. Four tick calculation modes.
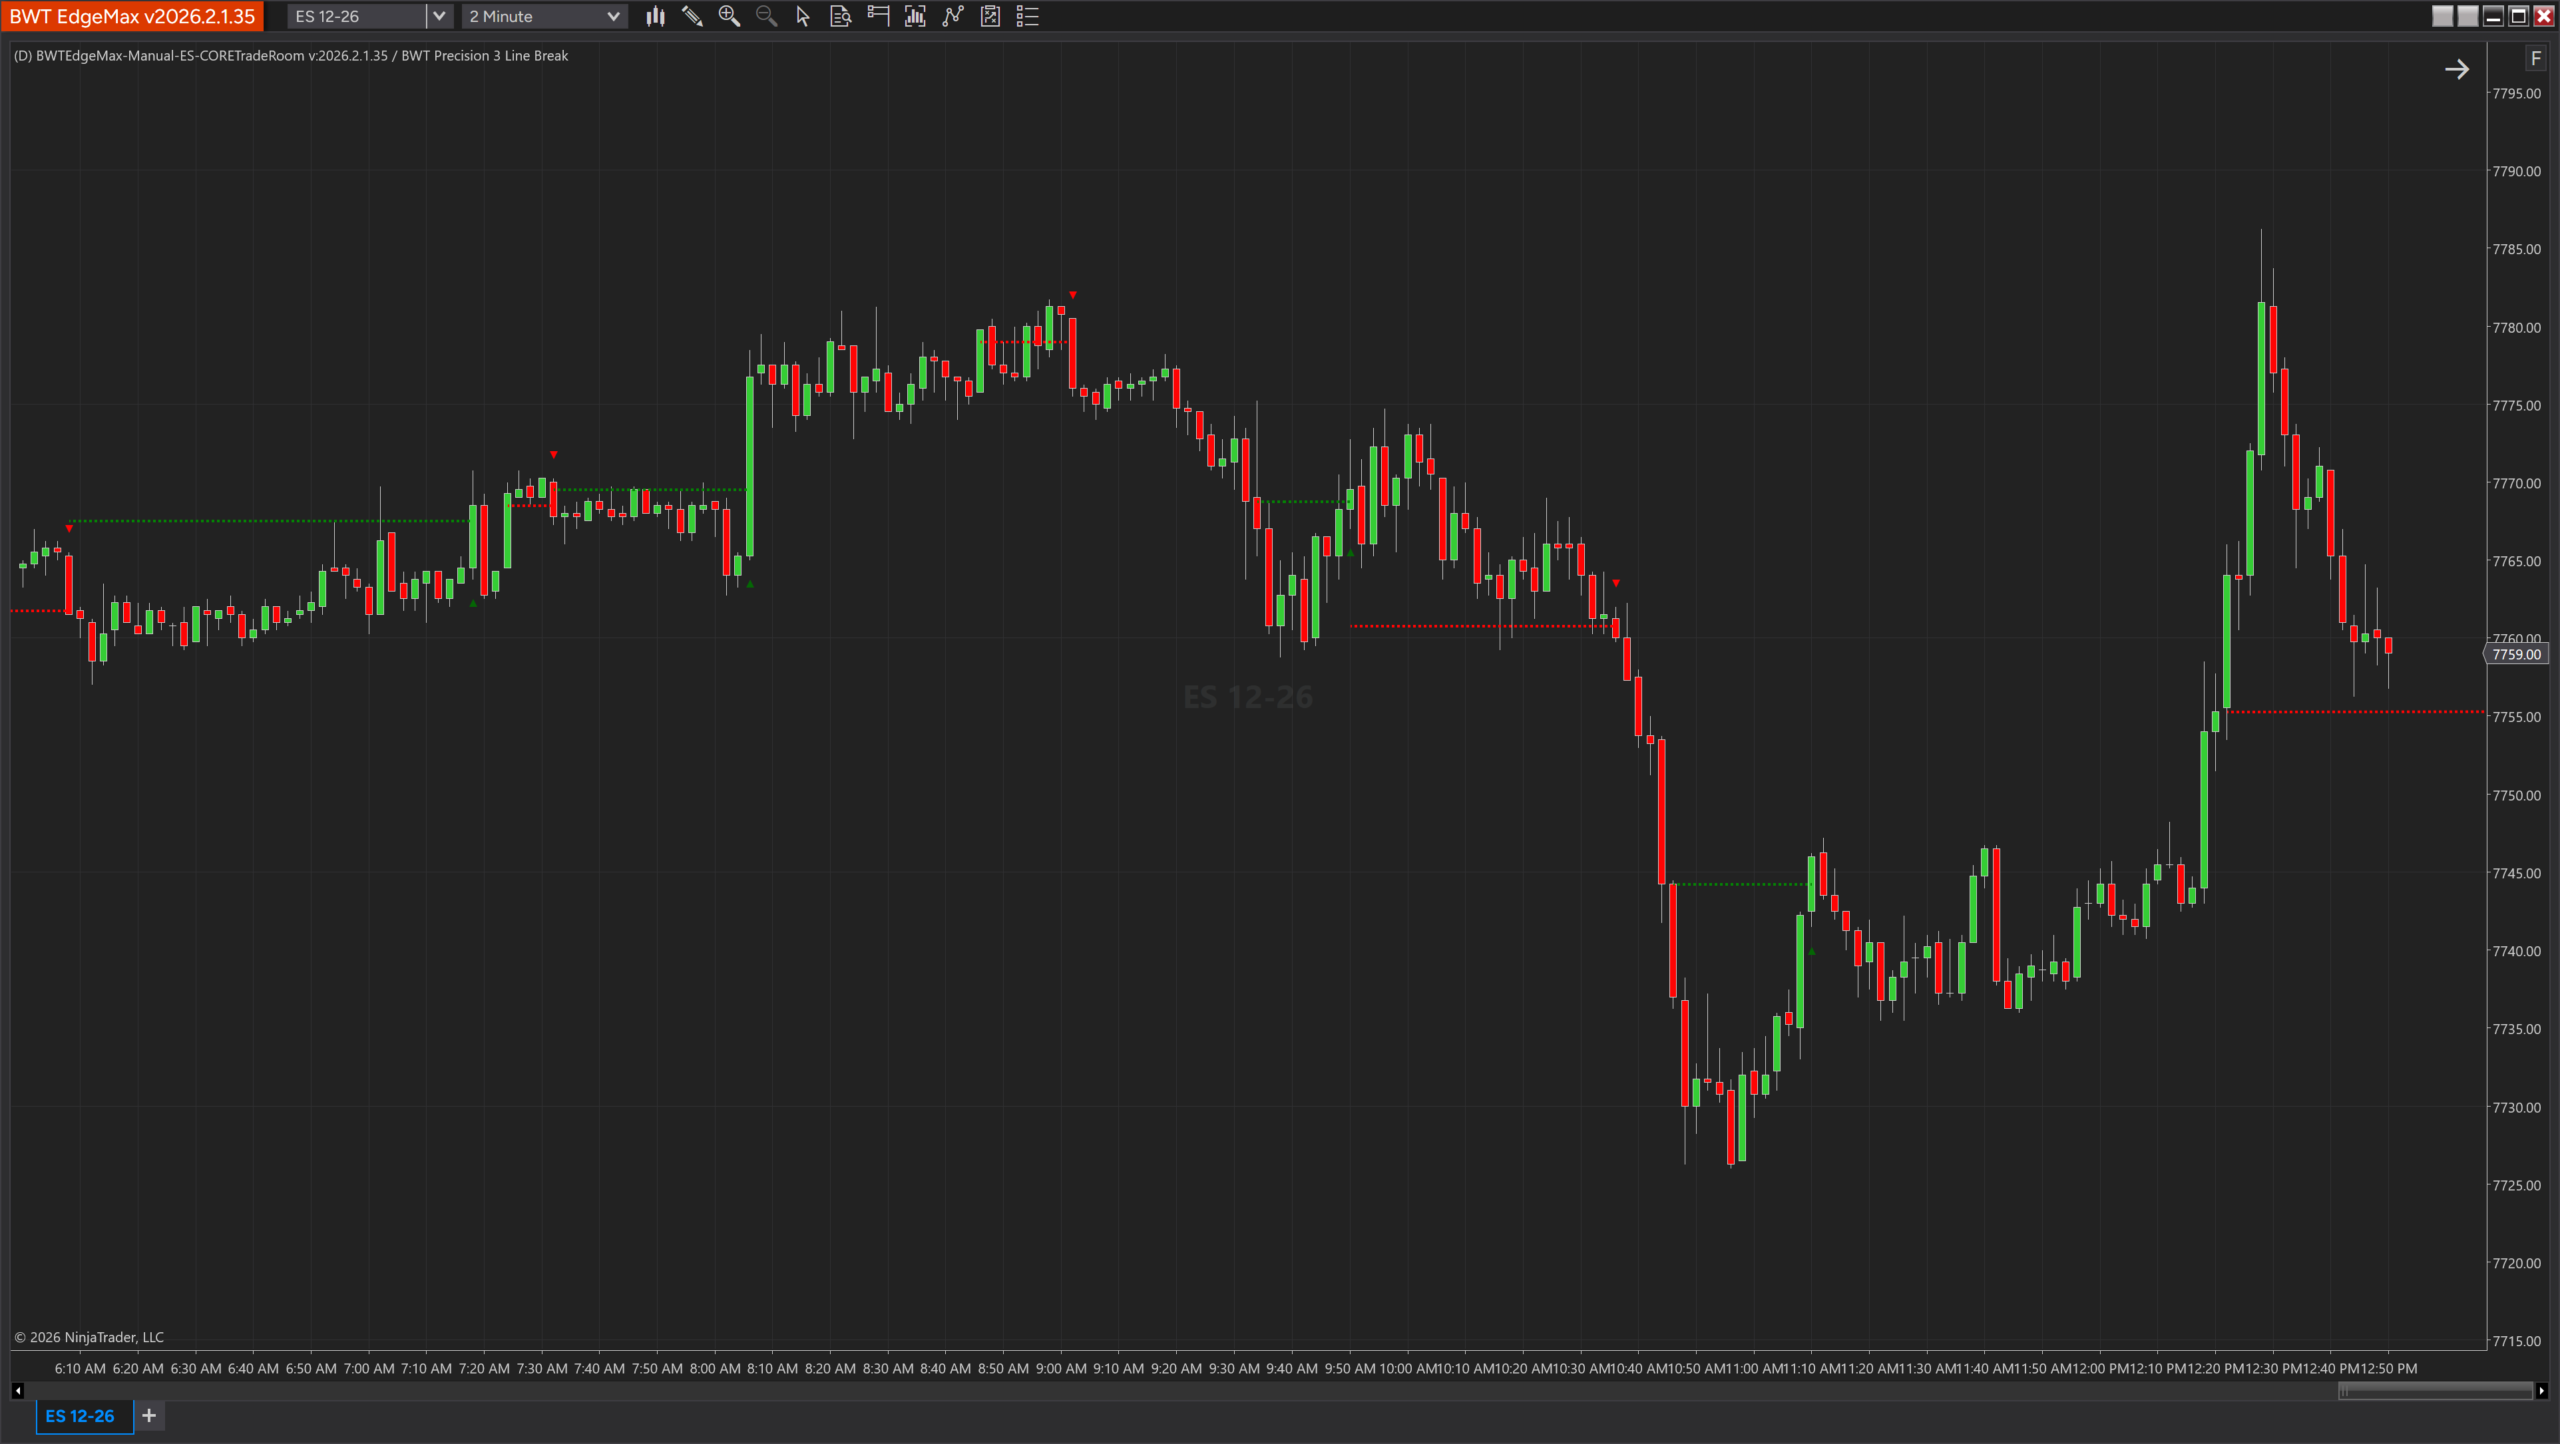
Volume divergenceJapanese renko-style trend reversal using brick formation. Signals when price breaks last N-brick extremes. Plots brick close line, long/short signals, and dynamic trigger lines. Powers the 3 Line Break signal module.
Market
Internals
Real-time NYSE TICK breadth analysis rendered as candlesticks with cumulative Advance/Decline line overlay. Plots TICK candlesticks (green/pink), A/D line (yellow), and extreme threshold markers at +/-800. Essential context for reading broad market participation behind price moves.
Breadth analysisICT
Concepts Suite
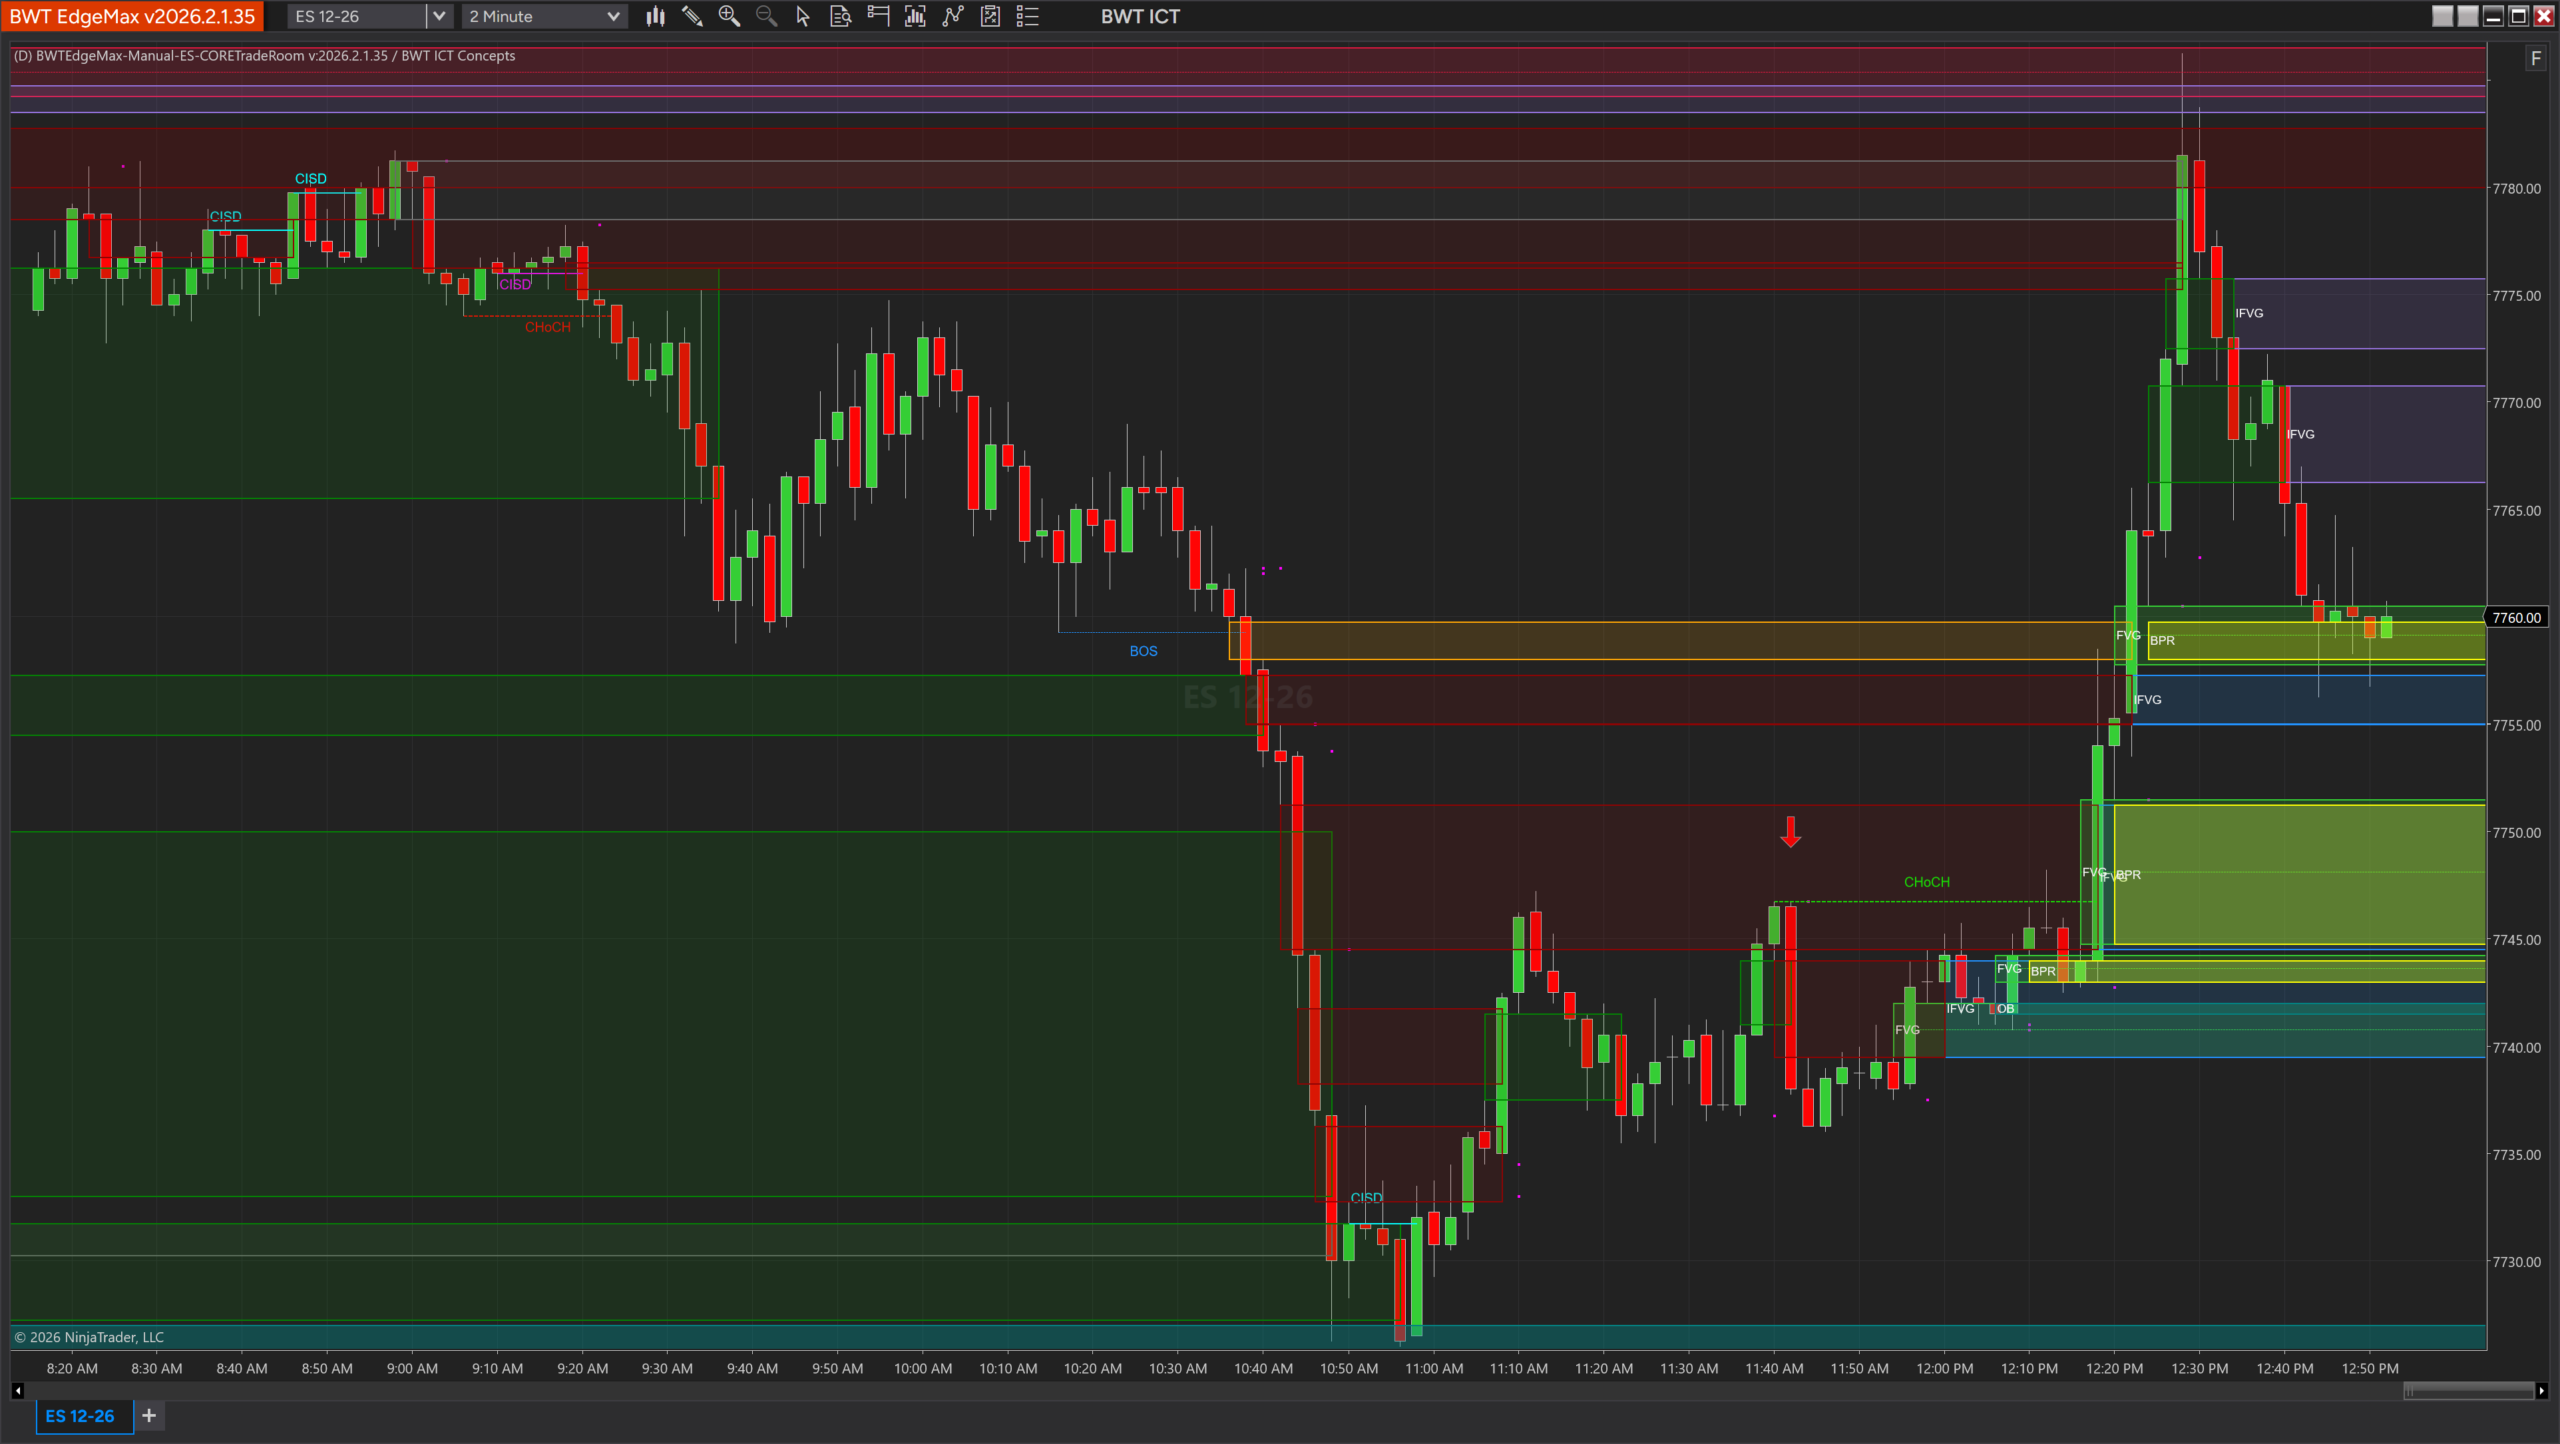
Institutional structure framework: Fair Value Gaps (FVGs), Order Blocks (OBs), and six market kill zones (Asia, London, NY-AM, Lunch, NY-PM, Overnight). Shaded zones with directional annotation.
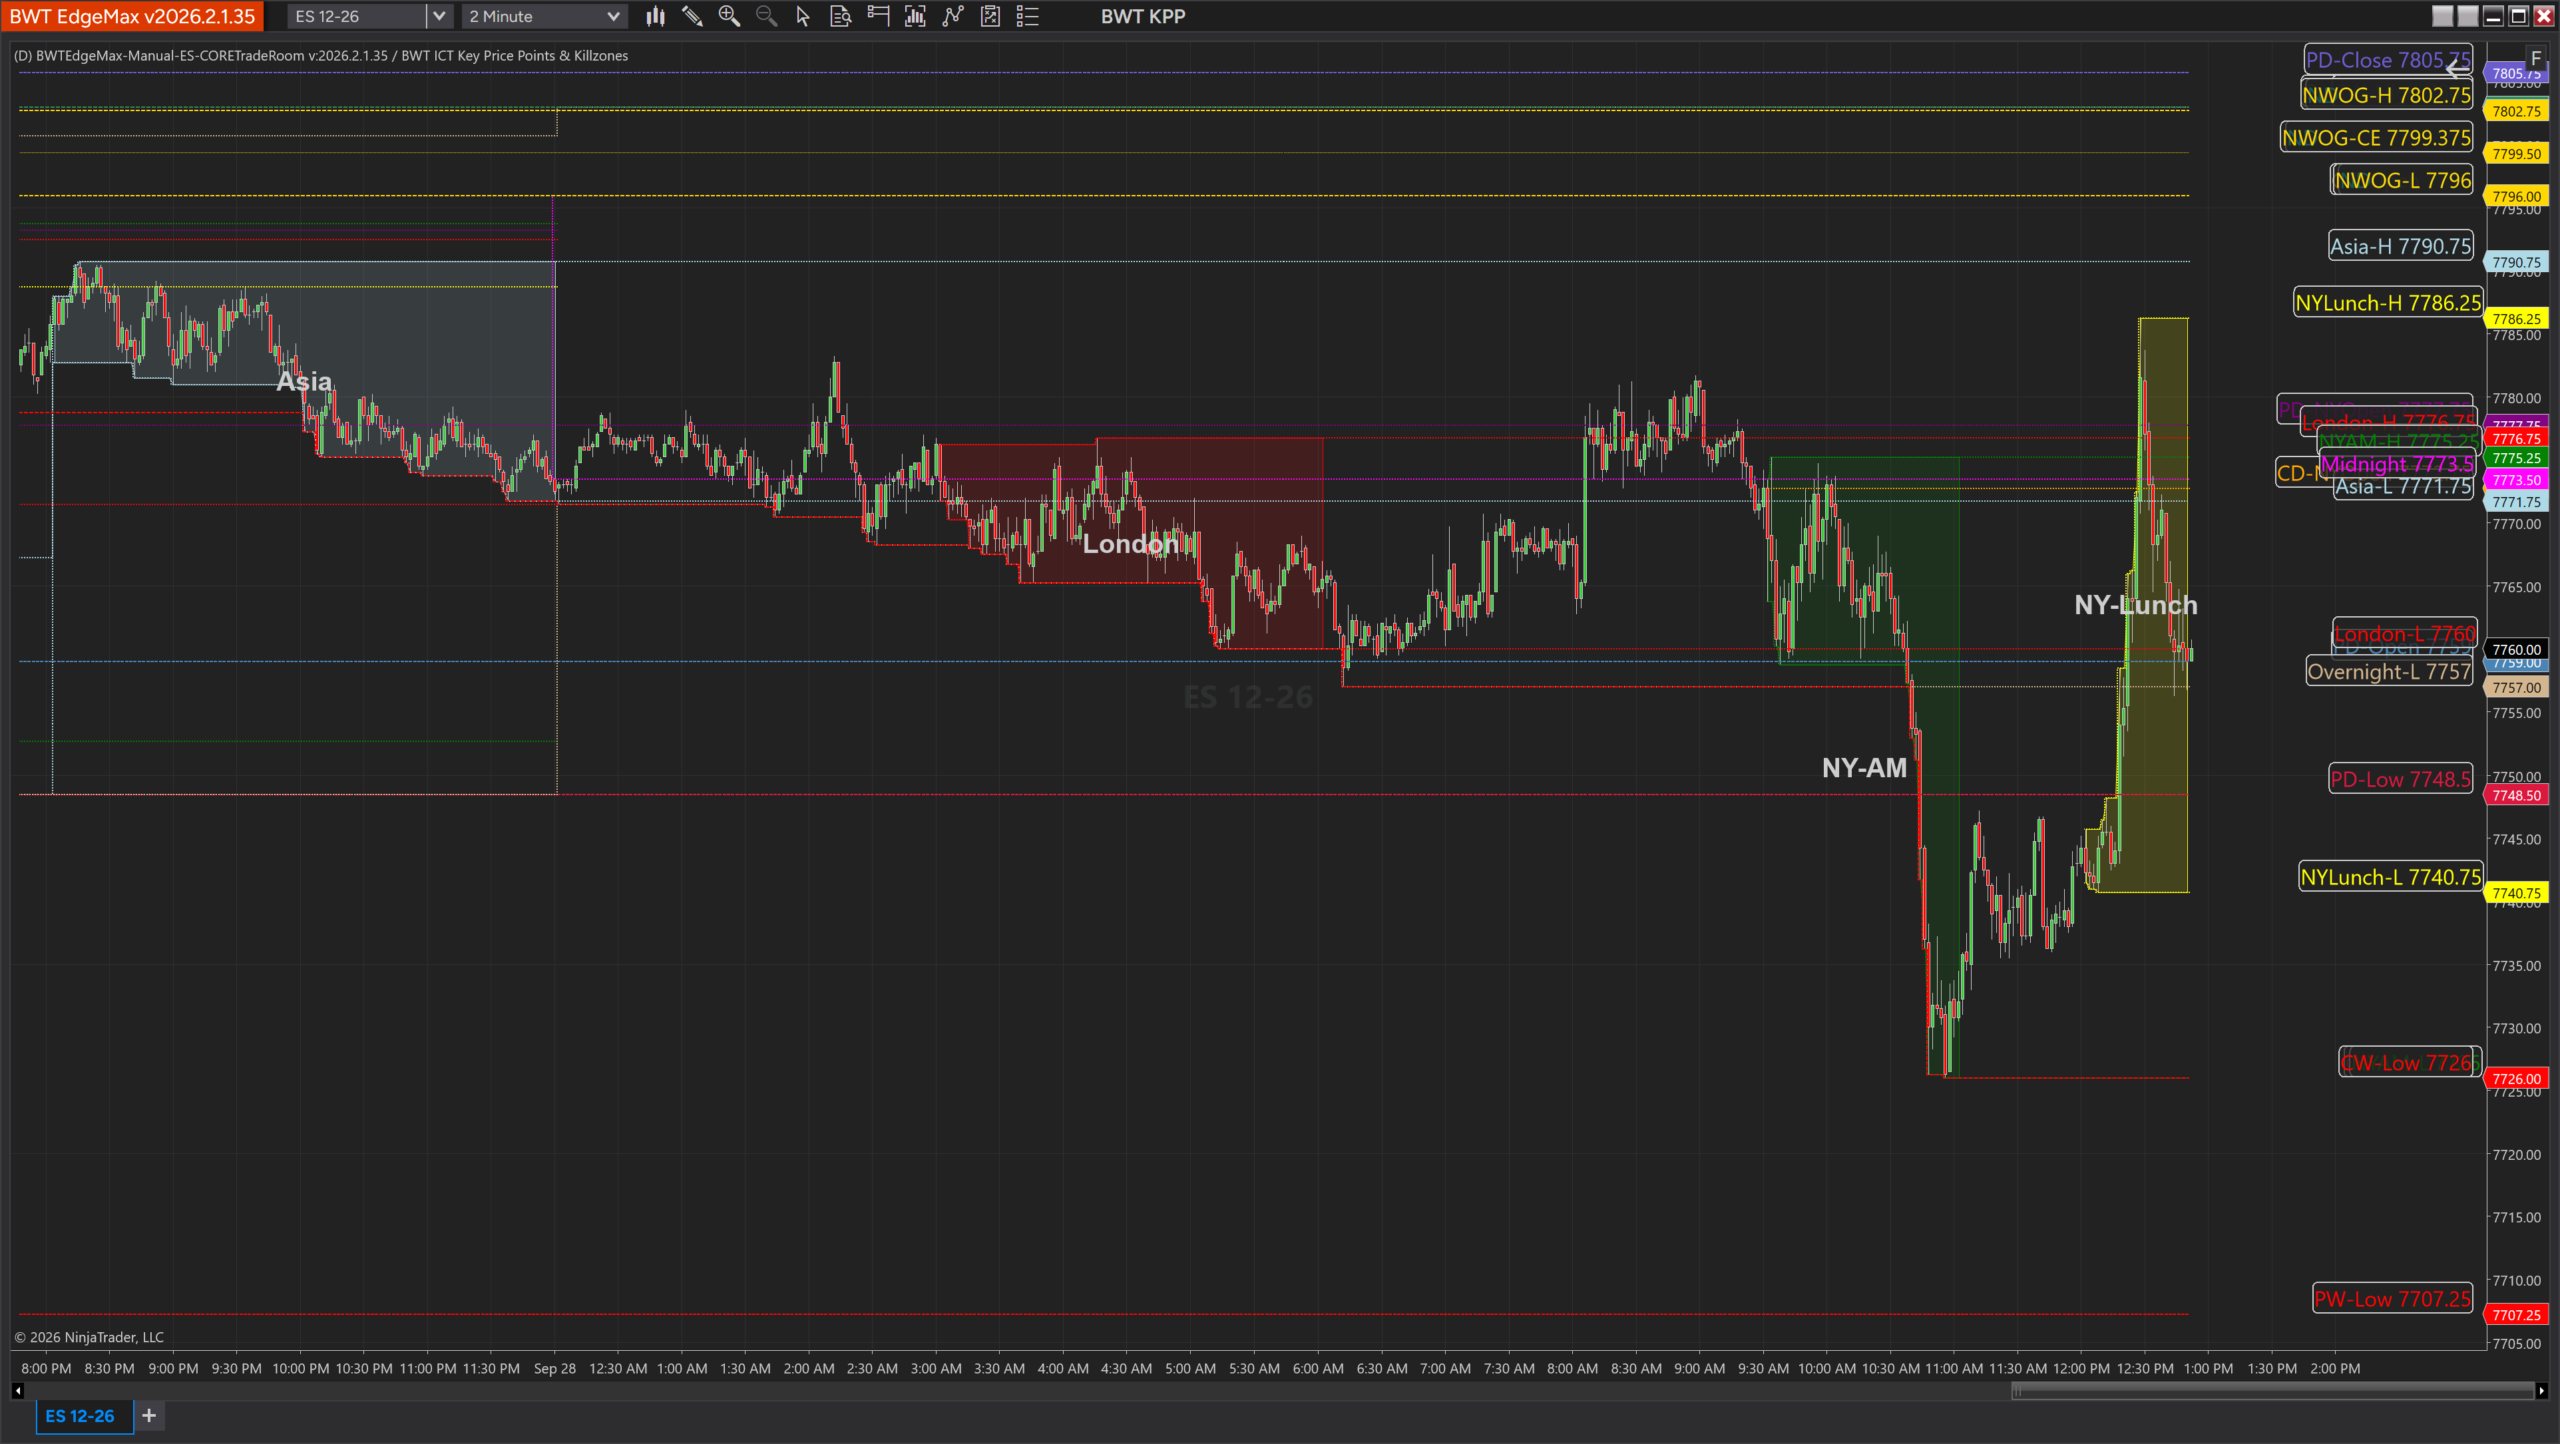
Prior day OHLC and current day OHLC with six labeled killzone regions. Clear reference framework for ICT traders who need session context and prior-day levels on their chart at all times.
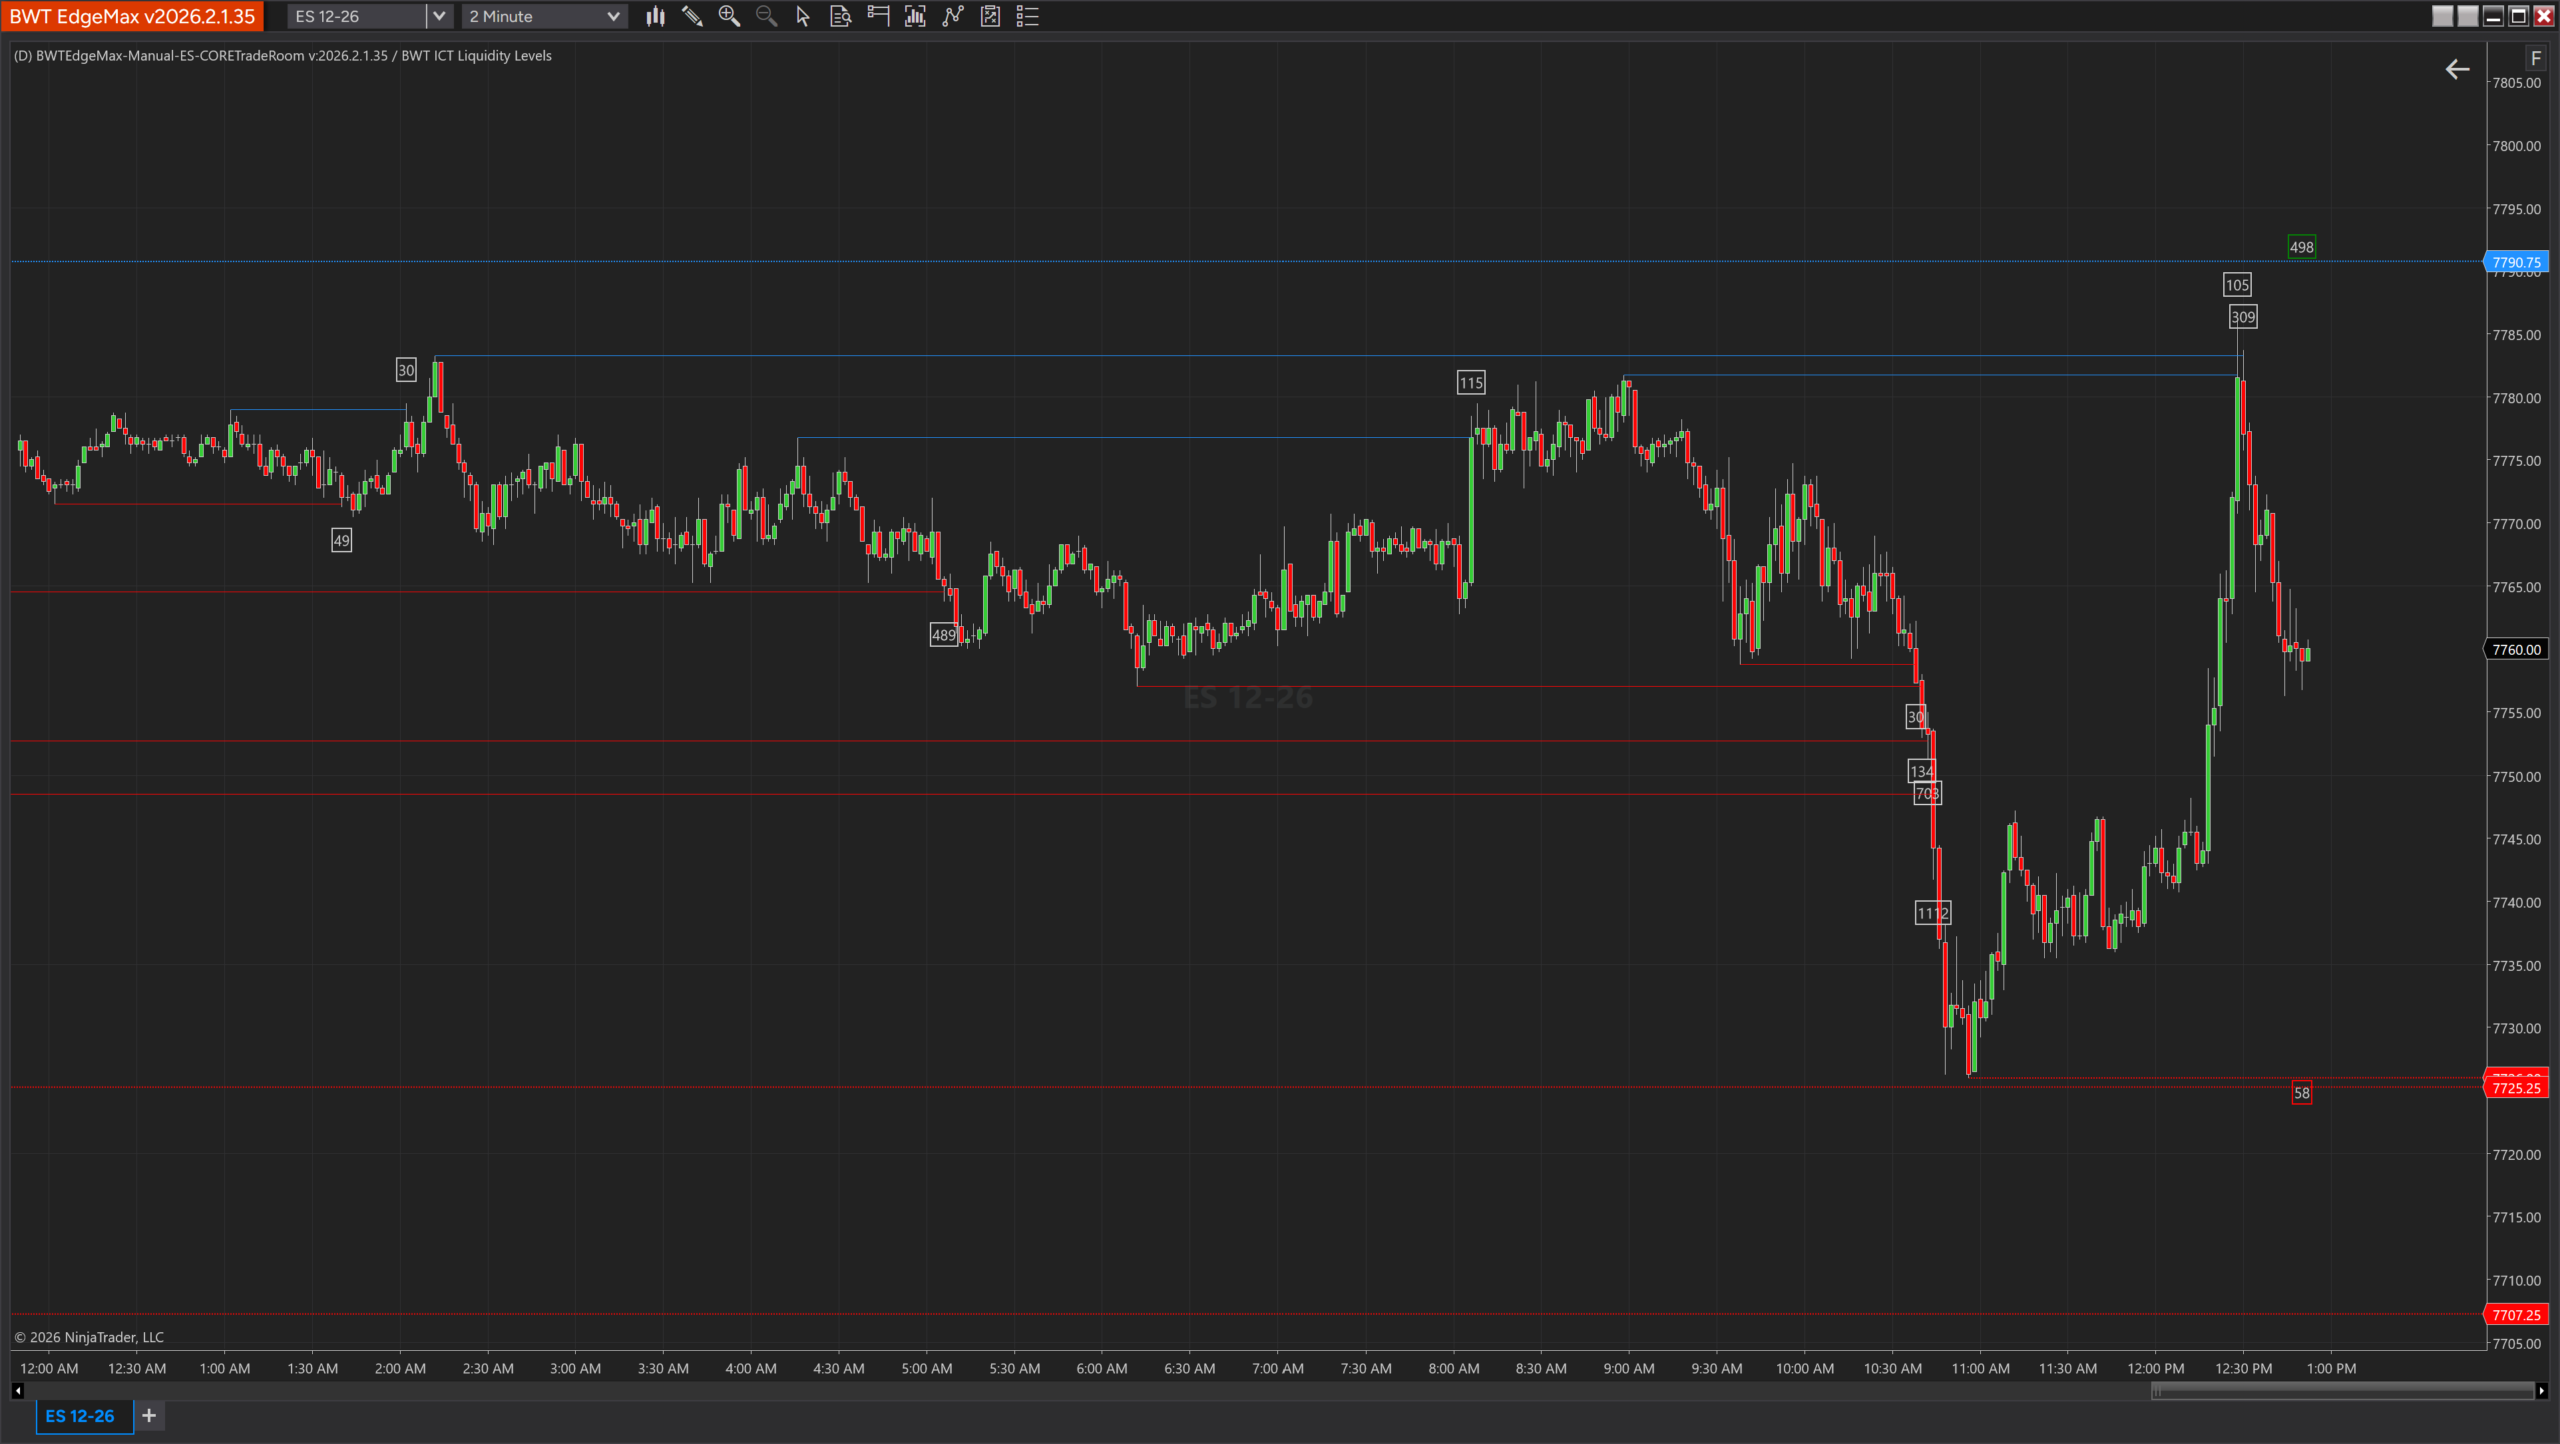
Weighted swing-based liquidity detection. Tracks closest unmitigated buy-side and sell-side zones with weight labels based on bar count since formation. Alerts on sweep with optional text-to-speech.
Utility
Indicators
Multi-position chart annotation. Place up to 5 custom text notes at fixed screen positions (TopLeft, TopRight, BottomLeft, BottomRight, Center) with configurable fonts and colors. Keep your trading rules visible.
AnnotationReal-time system diagnostics overlay: computer clock vs chart time comparison, lag delta (color-coded yellow >0.5s, red >1s), available RAM, and network latency. Know immediately if your system is running clean.
DiagnosticsAll Indicators Free with
EdgeMax™ Full Engine
The Precision Suite is $49/mo. EdgeMax Full Engine is $99/mo — and includes all 31 indicators plus the complete execution platform. For $50 more, you get Algo Mode™, Discretionary Mode™, 5 signal modules, multi-bracket management, trail automation, and Command Center Mobile.
The indicator suite is designed as a deliberate stepping stone. Once you see the analytical edge, the execution platform is the obvious next step.